Reports extension for Vtiger CRM
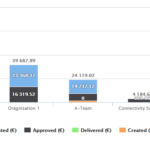
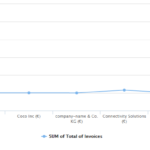
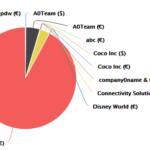
Powerful reporting Vtiger extension with dynamic reports and interactive charts
You can create unlimited reports for all Vtiger and custom modules*
*Created with Vtiger standard
Main Features of Reports4You extension
What is Key Metrics feature for?
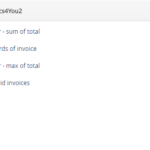
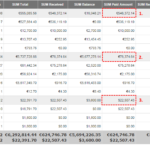
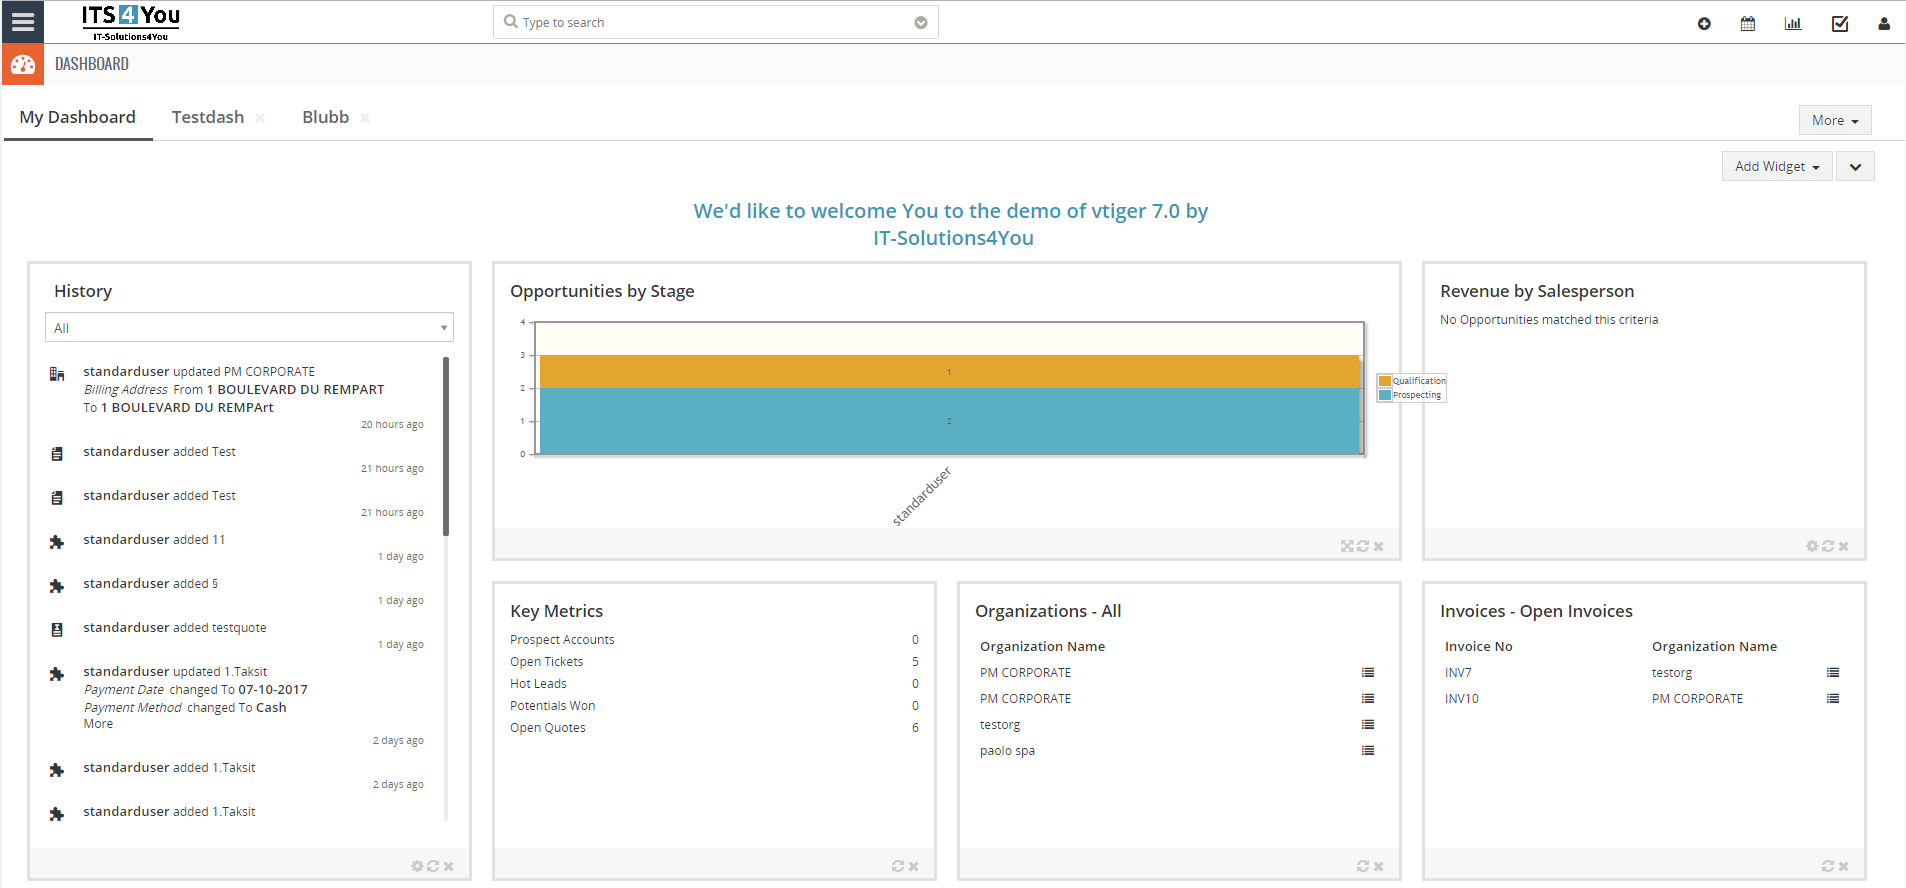
New functionality of Reports 4 You is Key Metrics. Key Metrics allows you create Views onDashboard with information like Count of records based on Filter. With Reports 4 You, Key Metricsalso allows, after creating Tabular Report, use these Metrics ( SUM, AVG, Min, Max) on Dashboard.
Who appreciate Limit and Sort order?
Try to answer:
- Don’t want to plenty of record in Report?
- Do you want for example Top 5 Organization with the most Paid Amount?
- Do you want to reward your employments and you are looking for the best selers?
- and much more other possibilities
Did you find yourself in some point?
Try to use Limit and Sort order.
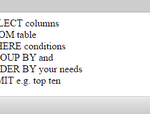
You are able to set Limit of shown records as well as sort based on fields Ascending or Descending.
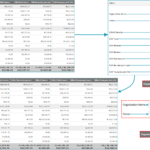
In Filters you can specify the conditions to filter the results in a report.We can specify conditions in Filters and Summaries Filters.Filters have all the fields from the selected module and its related modules where the comparator and condition can be choosed based on type of field selected. You are allowed to provide unlimited number of conditions, recommender into 5 conditions.
Filters – here you are able to create Filter, add new Condition to Filter  or add New Group of Filters
  . Course, there are options to Delete Condition
  as well as Group
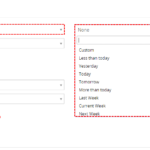
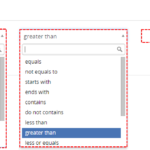
  . It is good to note our better comparators for time Columns (e.g. Less then today, More then today,Older than … day,…) and repair some standard comparators(e.g. Last/Next Days N,…). (For example you can use it to Report Invoices that are not paid more then 7,… days). Reports 4 You also allows you to compare 2 variables like (Invoice Date greater then field is Due Date)
Summaries filters – powerful option to create Filters from Summaries fields
Quick Filter – useful ability to edit quick filter in DetailView of Report
With the version of reports ITS4YouReports_2_8_0 and higher. You are able to use Bing maps with our reports!
- To start using Bing maps you need to create API Key. You can do that by going into Reports module, then click on the button
 and select “API Key Settings”.
 - You must create key for Default usage or users can have their own key. How to get the Bing Map Key simply click on this URL text, see image below:

- You will be redirected to the guide how to get a Bing Maps Key. Obtain key and choose if you want it for Default or User defined and paste the key in the window. Then “Save”.
After you successfully created and applied Bing Map Key, you can proceed to create or edit your reports. When you are creating report you have a step called “Maps” see image below:
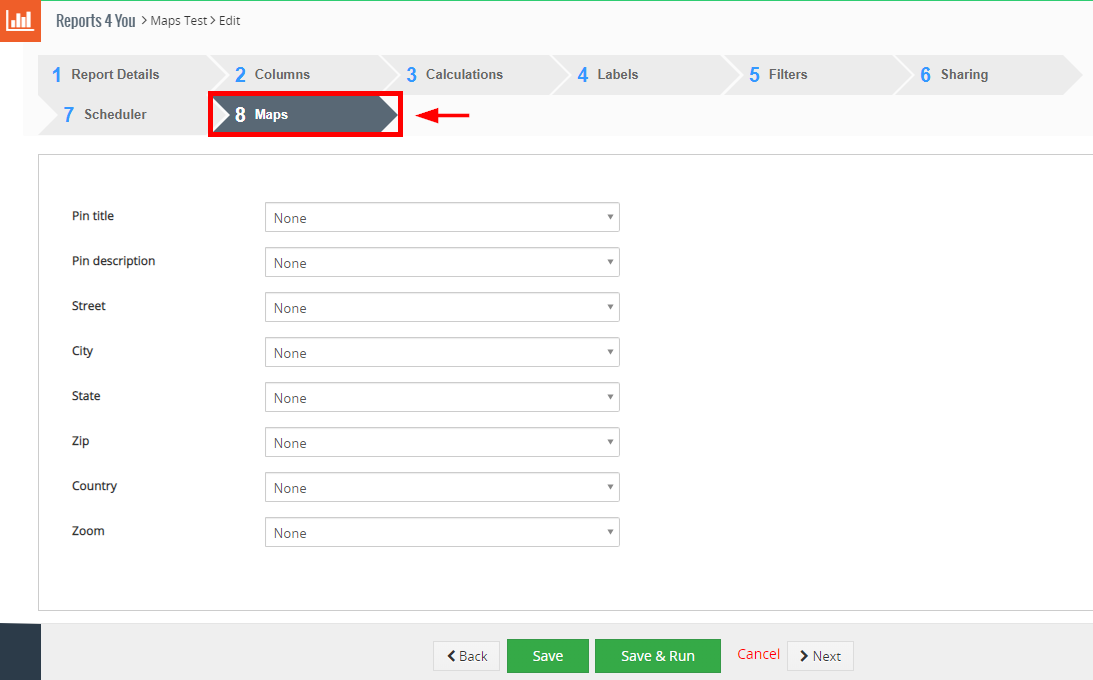
You will have to select mapping for the fields in this step, explanation of the fields is below:
- Pin title – title for the pin which will be shown on the map, select any value from the pick list
- Pin description – select field which will be used as description
- Street – select street field, for example Billing Street
- City – select city field, for example Billing City
- State – select state field, for example Billing State
- Zip – select postal code/zip field, for example Billing Postal Code
- Country – select country field, for example Billing Country
- Zoom – how much zoomed your map will be (optimal is 7)
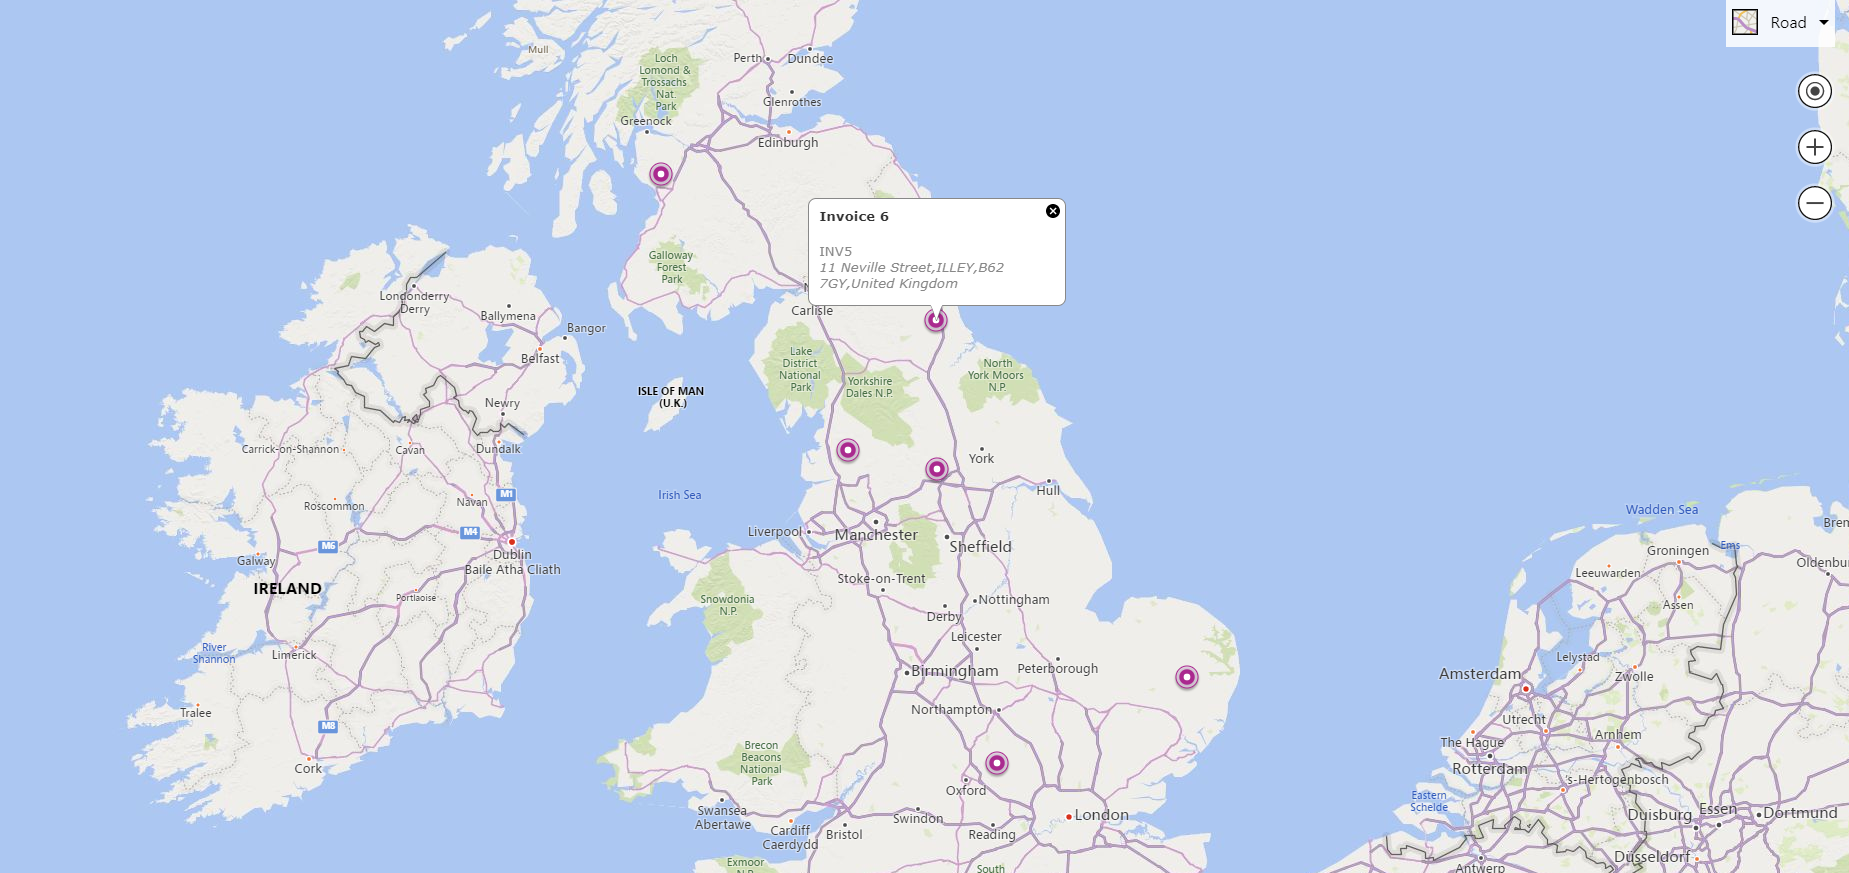
When you are done with “Maps” step, proceed with generating reports. In the detail view of the report, please click on the “Display Map” button like it’s shown on the image below:

The result is that our Invoices are shown on the map based on the Billing details used:
Start using Reports now!
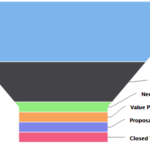
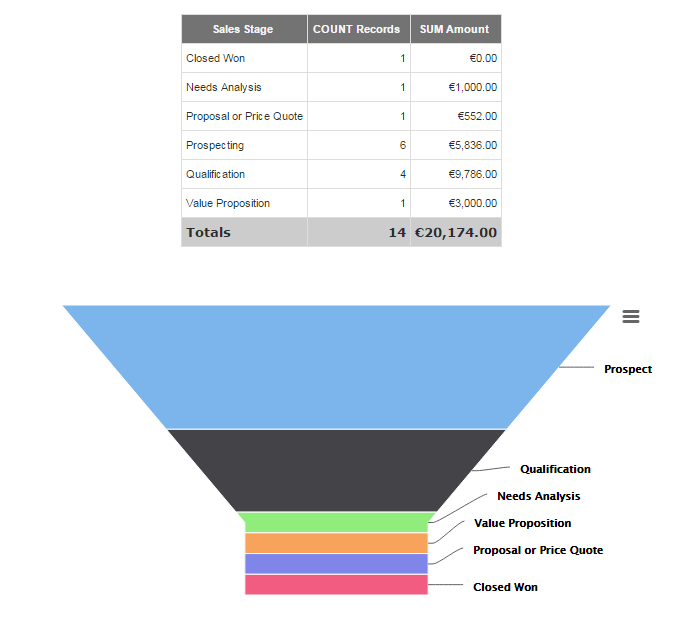
Do you want to have Opportunities by Sales Stage?
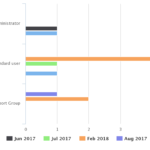
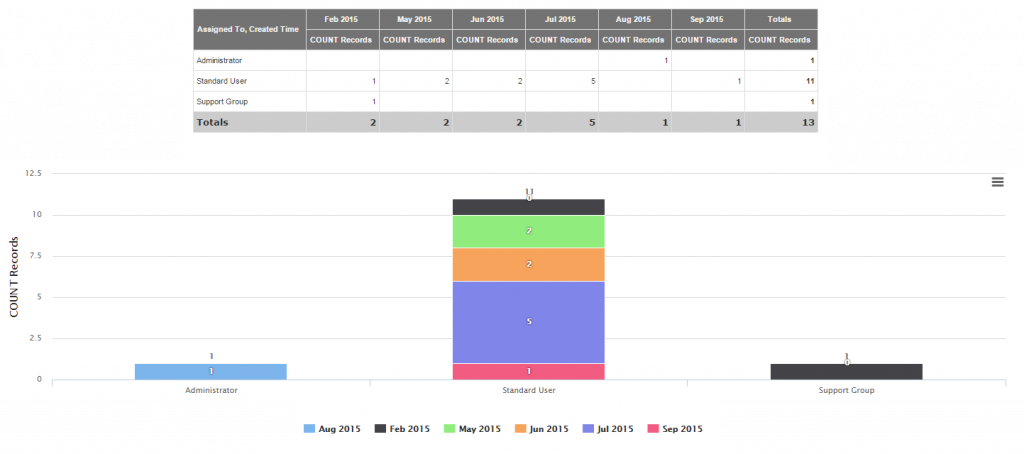
What about Tickets by User by Month?
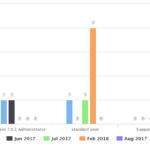
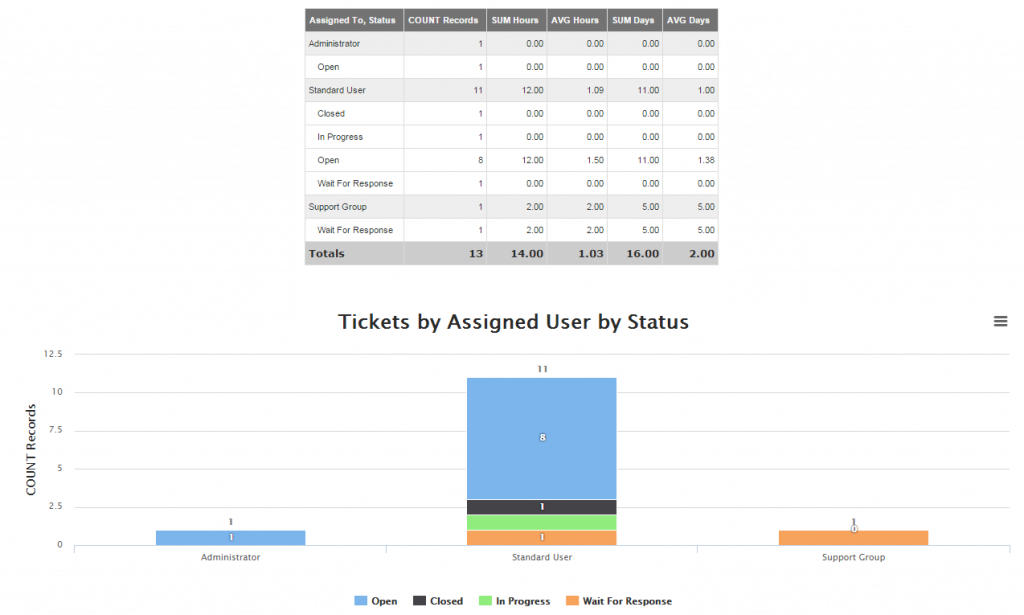
Do you want have owerview of Ticket and status for your Users?
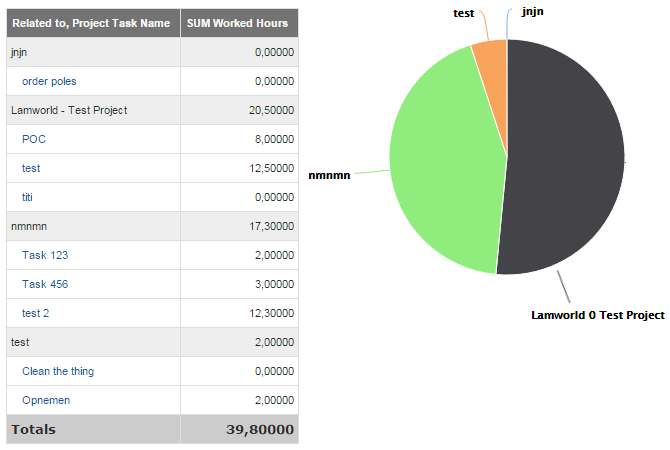
How many hours user spent on Projects?
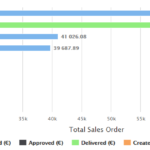
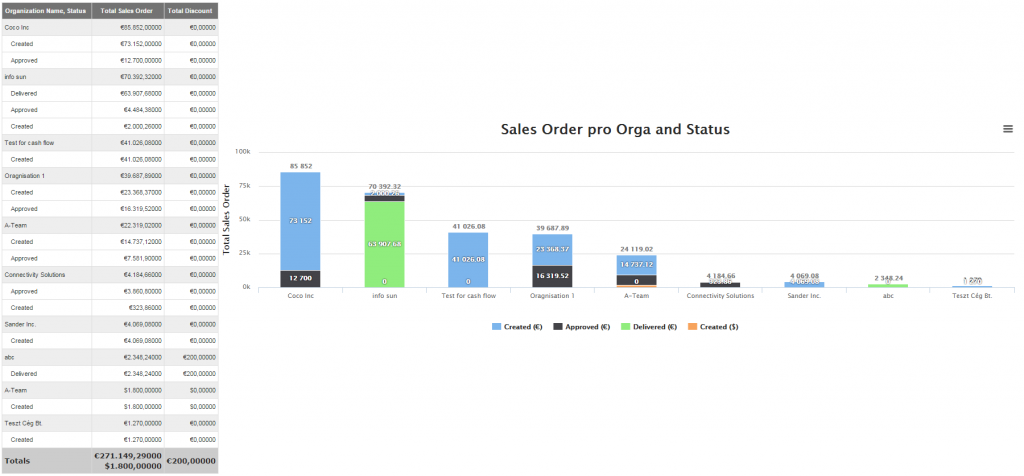
How many Sales Orders are related to Organisation?
Very well documented
Find manual for version of vtiger that you need


