

1.Introduction
Reports 4 You is the most powerful runtime and design environment for your custom reports
integrated into Vtiger CRM Open Source.
Main Features:
- Easy installation via module manager, does not modify your Vtiger source code
- You can create unlimited reports for all Vtiger CRM modules (incl. Vtiger compatible custom modules)
- Allows you to use all fields from primary module and his related modules
- Supports unlimited count of uitype 10 fields related to same module
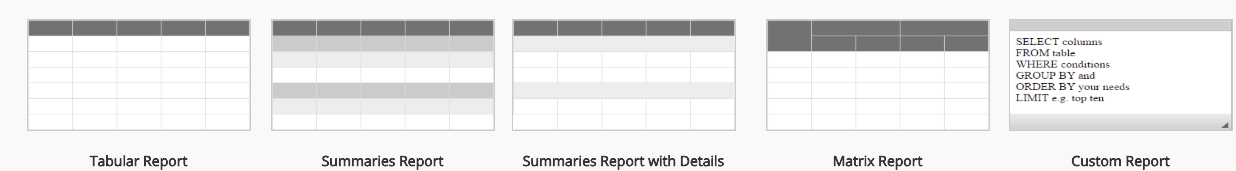
- 5 Report types (Tabular report, Summaries, Summaries with details, Matrix report and for admin user also Custom report)
- Custom Labels definition
- Enhanced conditions functionality
- Support of Scheduler
- Graphs in High Charts style, possible Add to dashboards – widgets
- PDF, Excel Export and print are possible
- Inclusive support & FREE Updates during first year after purchase (you can renew after one year to continue)
- Key Metrics functionality
- You are able to use Bing maps with our reports!
![]() Note: For versions ITS4YouReports_4_0 and higher, you will be needing to have installed our Installer in order to activate license keys.
Note: For versions ITS4YouReports_4_0 and higher, you will be needing to have installed our Installer in order to activate license keys.
2.How to install Reports 4 You
There are currently two options how to install extension:
- (Recommended) Using our Free extension Installer
(Please visit the Installer page for more info) - Manually installation using a .zip file
(You still need to have Installer in order to activate license)
![]() Note: For versions ITS4YouReports_4_0 and higher, you will be needing to have installed our Installer in order to activate license keys.
Note: For versions ITS4YouReports_4_0 and higher, you will be needing to have installed our Installer in order to activate license keys.
Since December 2019 we launched our extended version of Installer which helps you install modules and manage extensions.
2.1.Installation via Installer
Make sure you have Installer installed, you can download Installer via our E-shop when you log in under Free Downloads section.
Next, simply install Installer via Module Management in Vtiger CRM by importing the .zip file you downloaded.
After successful installation, you can access Installer in two ways:
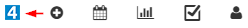
- by a click on Notifications Icon
 and then on the button
  ,
, - or via Main Menu – Settings – CRM Settings – Extensions – ITS4YouInstaller.
![]() Note: To see modules and manage licenses you have to log in to our e-shop with @email and password via
Note: To see modules and manage licenses you have to log in to our e-shop with @email and password via ![]() button (top right screen side in Installer module).
button (top right screen side in Installer module).
After log in, you can activate Extensions or our Packages licenses associated to your account via ![]() button.
button.
When the license was activated you can see module available in the Modules tab below.
Simply hit the ![]() button and Extension is installed now.
button and Extension is installed now.
![]() There is one extra step to do to finish installation of Reports extension.
There is one extra step to do to finish installation of Reports extension.
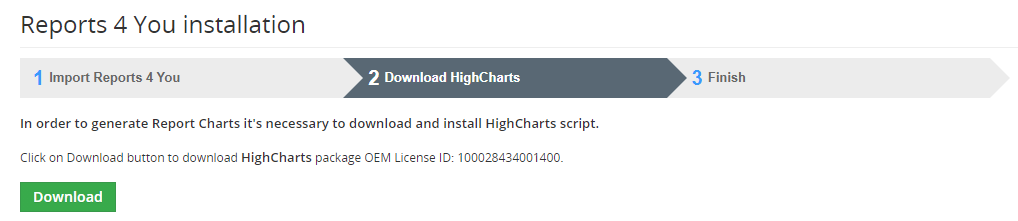
After Installation when you access module, you need to also Import “HighCharts” for reports.
Please follow next steps:
- Access the Reports via menu Tools – Reports 4 You.
- The following screen will appear, please press
 or
or  button.
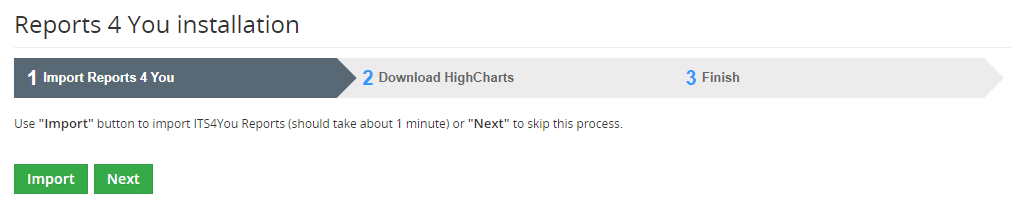
Reports – HighCharts Installation - If the “Import” button did not downloaded Charts automatically, you need import Charts manually, please hit
 button.
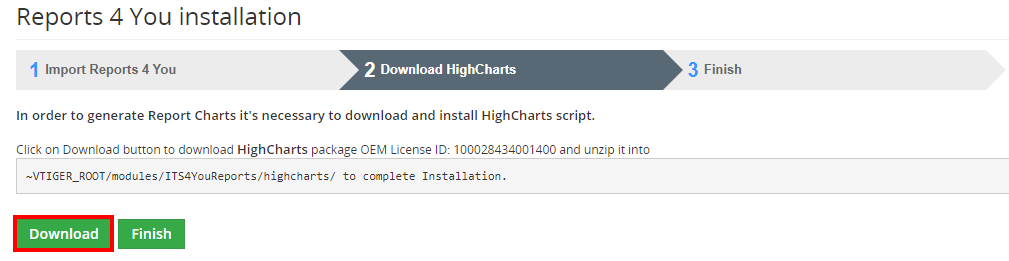
Reports – HighCharts Installation - Next, go to the ~VTIGER_ROOT/modules/ITS4YouReports directory and create a folder with name: highcharts
- Next, open the downloaded .zip file and copy all files to the ~VTIGER_ROOT/modules/ITS4YouReports/highcharts/ directory.
- It should be like in the image shown below:
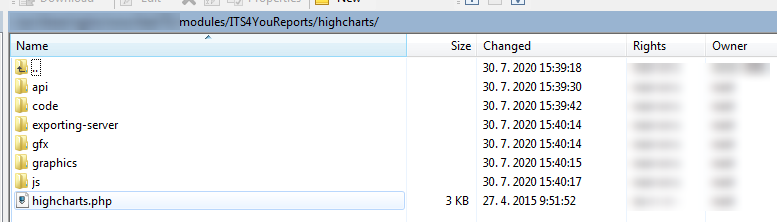
Reports – HighCharts Installation - Next, go back to your CRM and press the
 button, Reports are now successfully installed and you can start using the extension.
2.2.Manual Installation
Please provide following steps in order to install Reports:
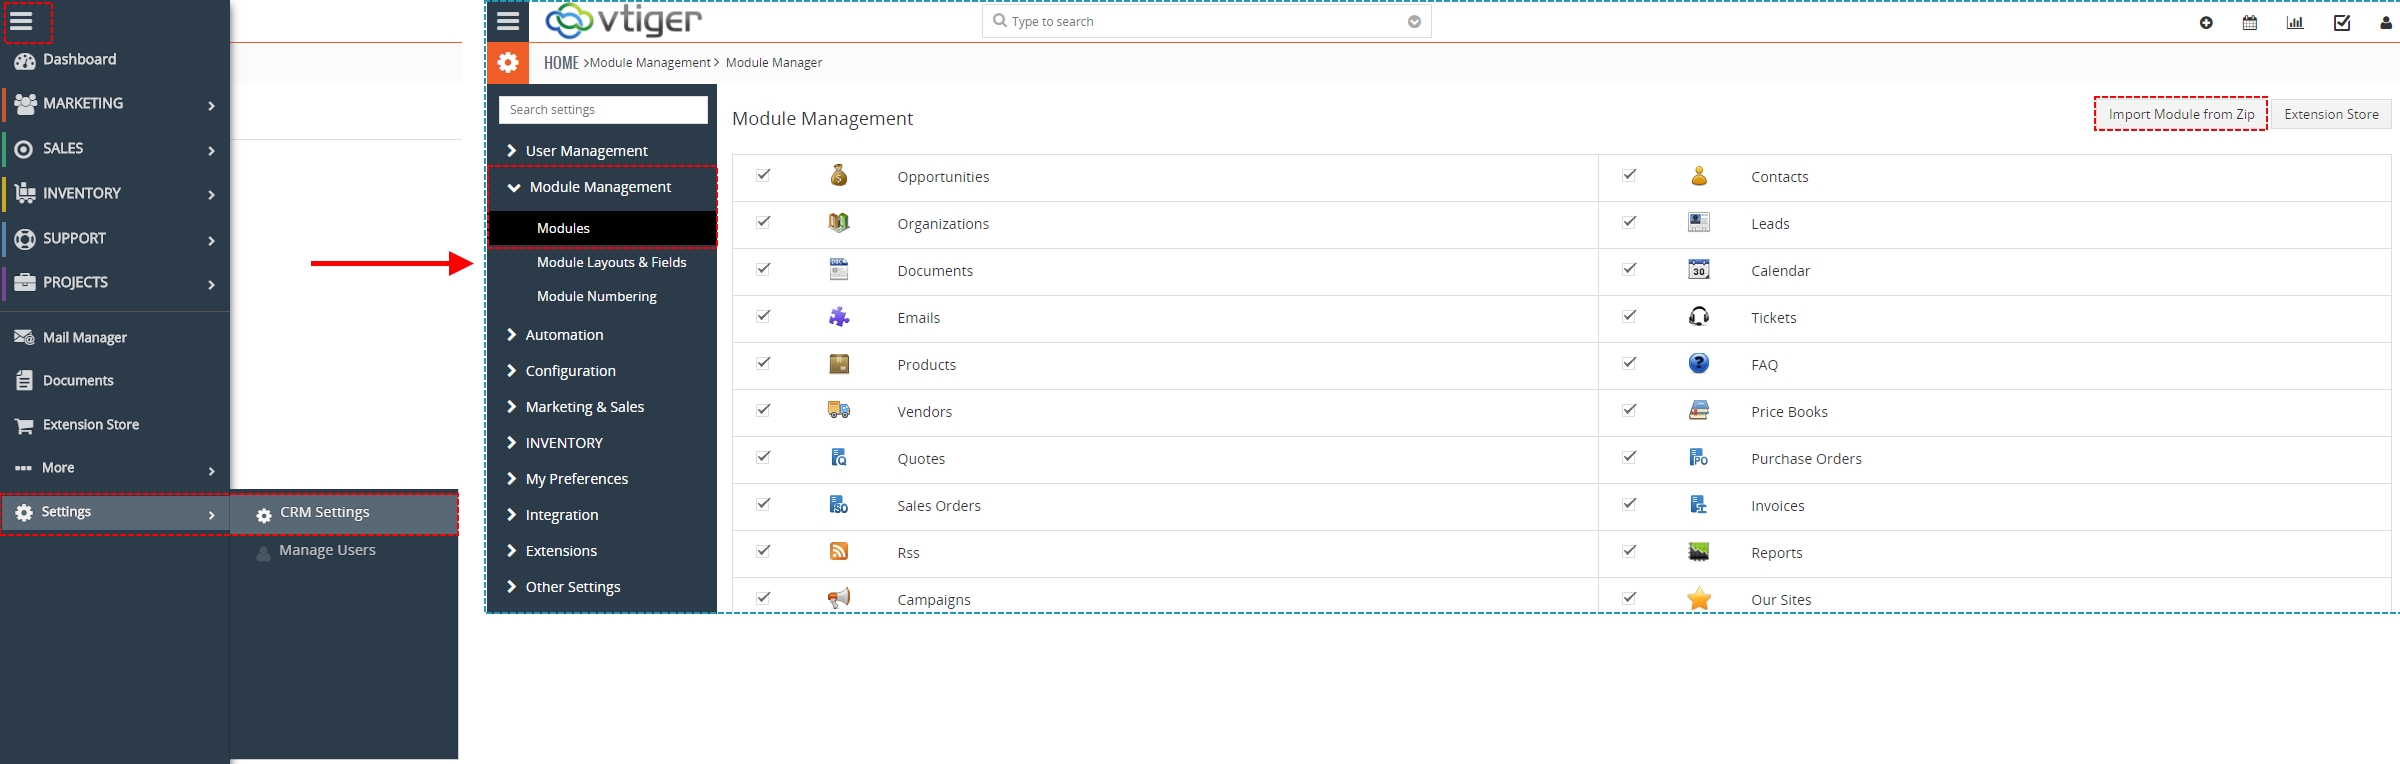
- Install the .zip (package) file of the Reports 4 You module via Setting -> CRM Settings -> Module Management -> Modules. Click on the Import Module from Zip.
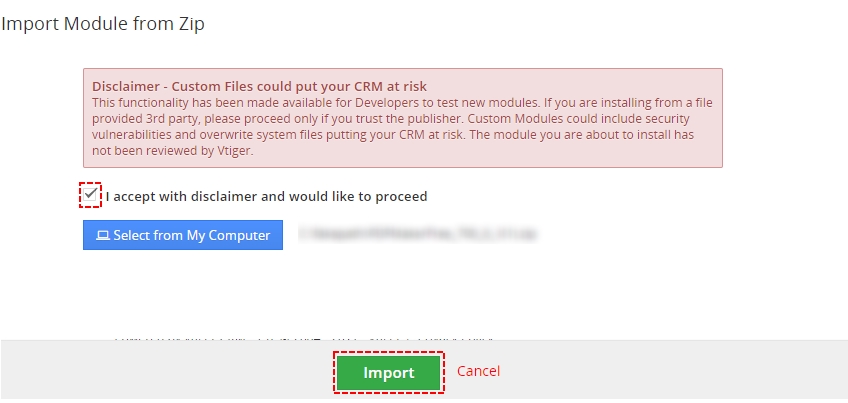
Installation step 1 -Reports 4 You Vtiger 7 - Select the .zip (package) file that you downloaded from our shop. Please check that you accepted the disclaimer and would like to proceed. Click on the [Import] button.
Installation step 2 -Reports 4 You Vtiger 7 Note: If you have after this step error message: Sorry! Attempt to access restricted file. Please check if folder test/vlib has correct write permission for browser (apache, www-data).
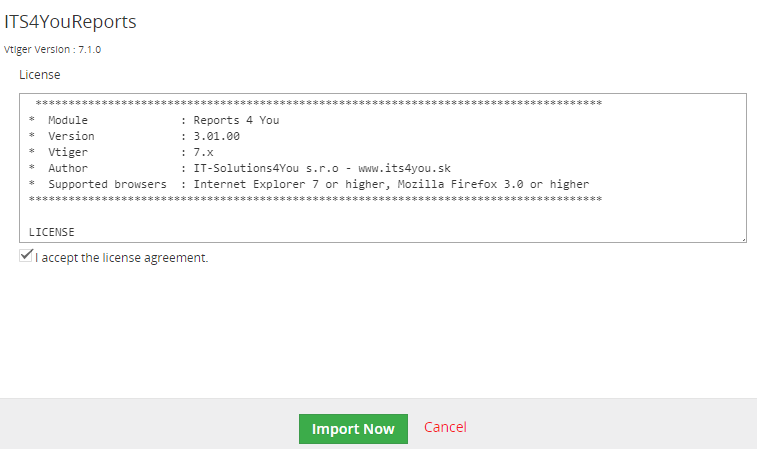
- Verify the import details parsed from the .zip (package) file. Please check that you accepted the license agreement and click [Import Now] to proceed or [Cancel] to cancel.
Installation step 3 -Reports 4 You Vtiger 7 - Reports 4 You was imported
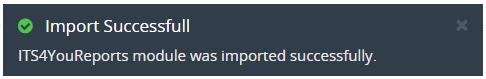
Installation step 4 – Reports 4 You Vtiger 7
![]() Note: In order to finish installation, you need activate license. For that please use our Installer
Note: In order to finish installation, you need activate license. For that please use our Installer
![]() There is one extra step to do to finish installation of Reports extension.
There is one extra step to do to finish installation of Reports extension.
After Installation when you access module, you need to also Import “HighCharts” for reports.
Please follow next steps:
- Access the Reports via menu Tools – Reports 4 You.
- The following screen will appear, please press or button.
Reports – HighCharts Installation - If the “Import” button did not downloaded Charts automatically, you need import Charts manually, please hit button.
Reports – HighCharts Installation - Next, go to the ~VTIGER_ROOT/modules/ITS4YouReports directory and create a folder with name: highcharts
- Next, open the downloaded .zip file and copy all files to the ~VTIGER_ROOT/modules/ITS4YouReports/highcharts/ directory.
- It should be like in the image shown below:
Reports – HighCharts Installation - Next, go back to your CRM and press the button, Reports are now successfully installed and you can start using the extension.
3.How to update Reports 4 You
The upgrade of the module is initiated manually or via our Installer.
Updating via Installer:
- open the Installer in the CRM
- in the Modules tab find your installed module and you should see the
 button available
 - If the new version is available, you will be notified via Installer Notifications icon
Updating Reports manually:
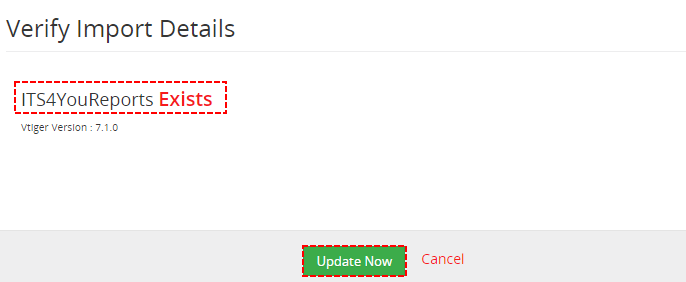
So please refer to above installation part for details how to initiate the import of the module from the file. As can be seen on following picture you will be notified that the Reports 4 You module already exists. The upgrade will start immediately when you click on the  button.
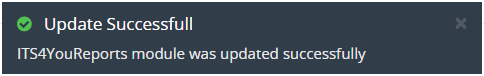
After upgrade the notification about successful upgrade is shown.
4.Quick Start
In the following sections you can find short description of Report’s types and how to create your first simple Report for vtiger CRM using Reports 4 You and.
Note: The full description of the Reports 4 You menus, tabs and icons can be found in the later chapters.
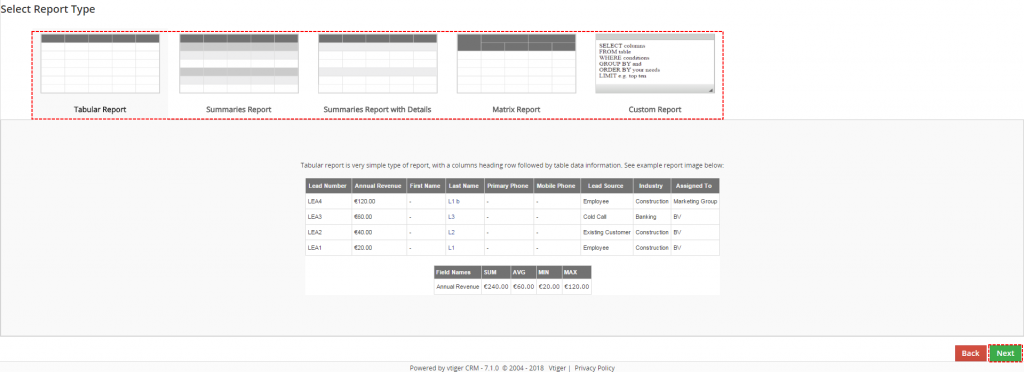
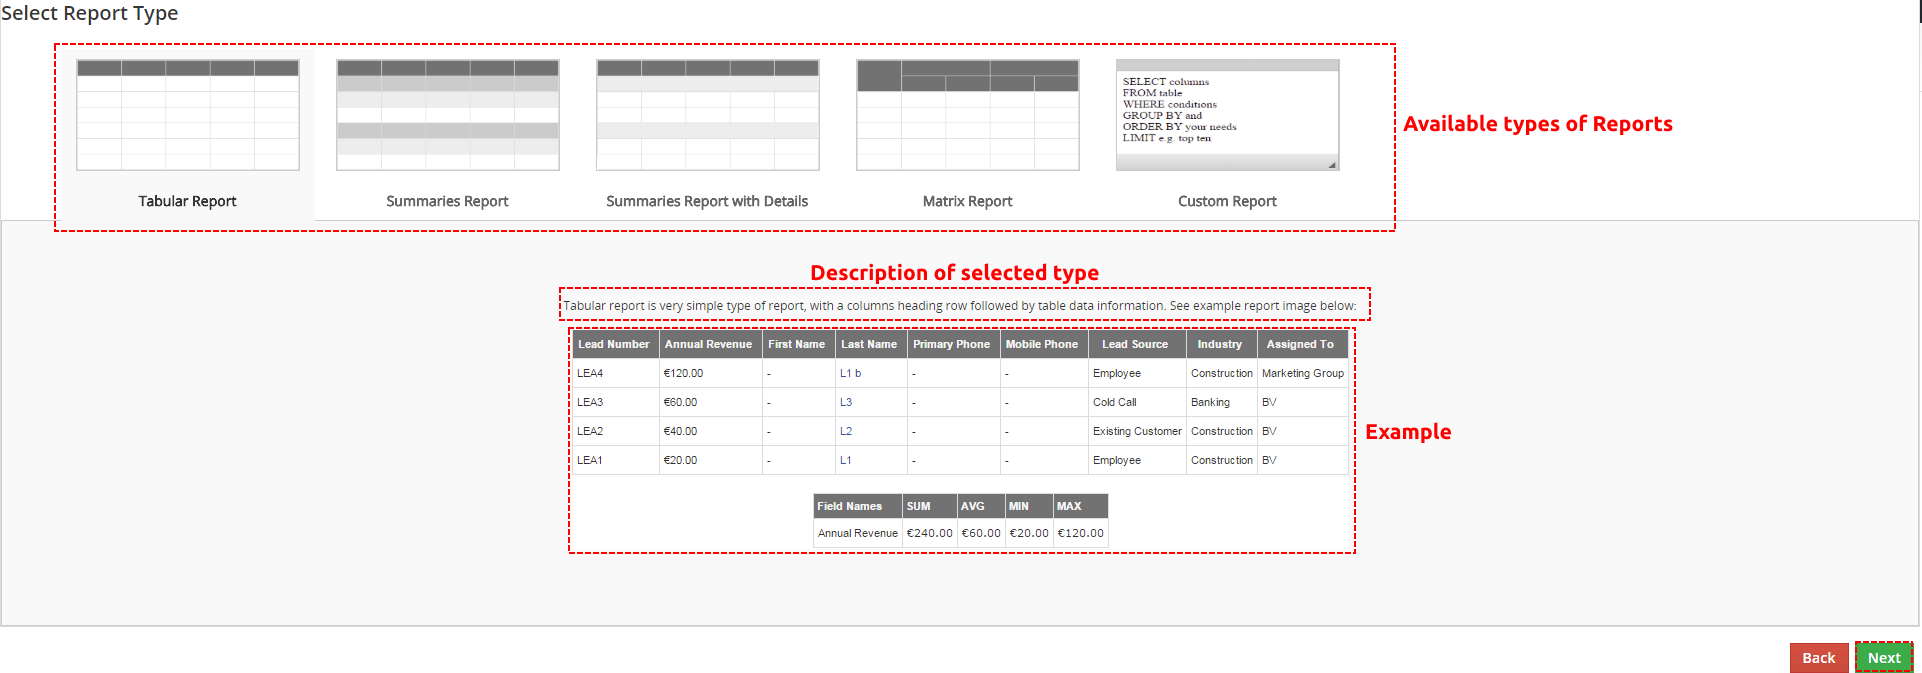
4.1.Types of Reports
You are able to create 4 types of Reports like Standard User
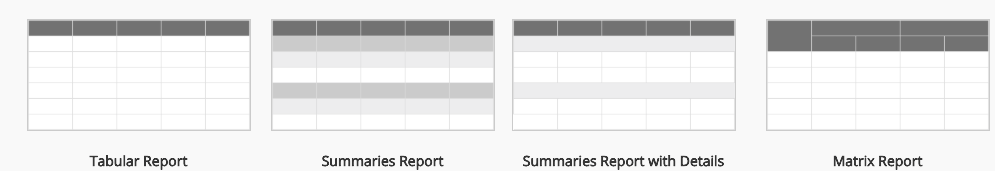
and 5 types of Reports like Admin User.
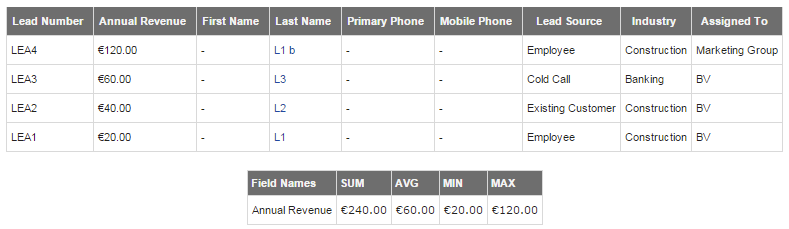
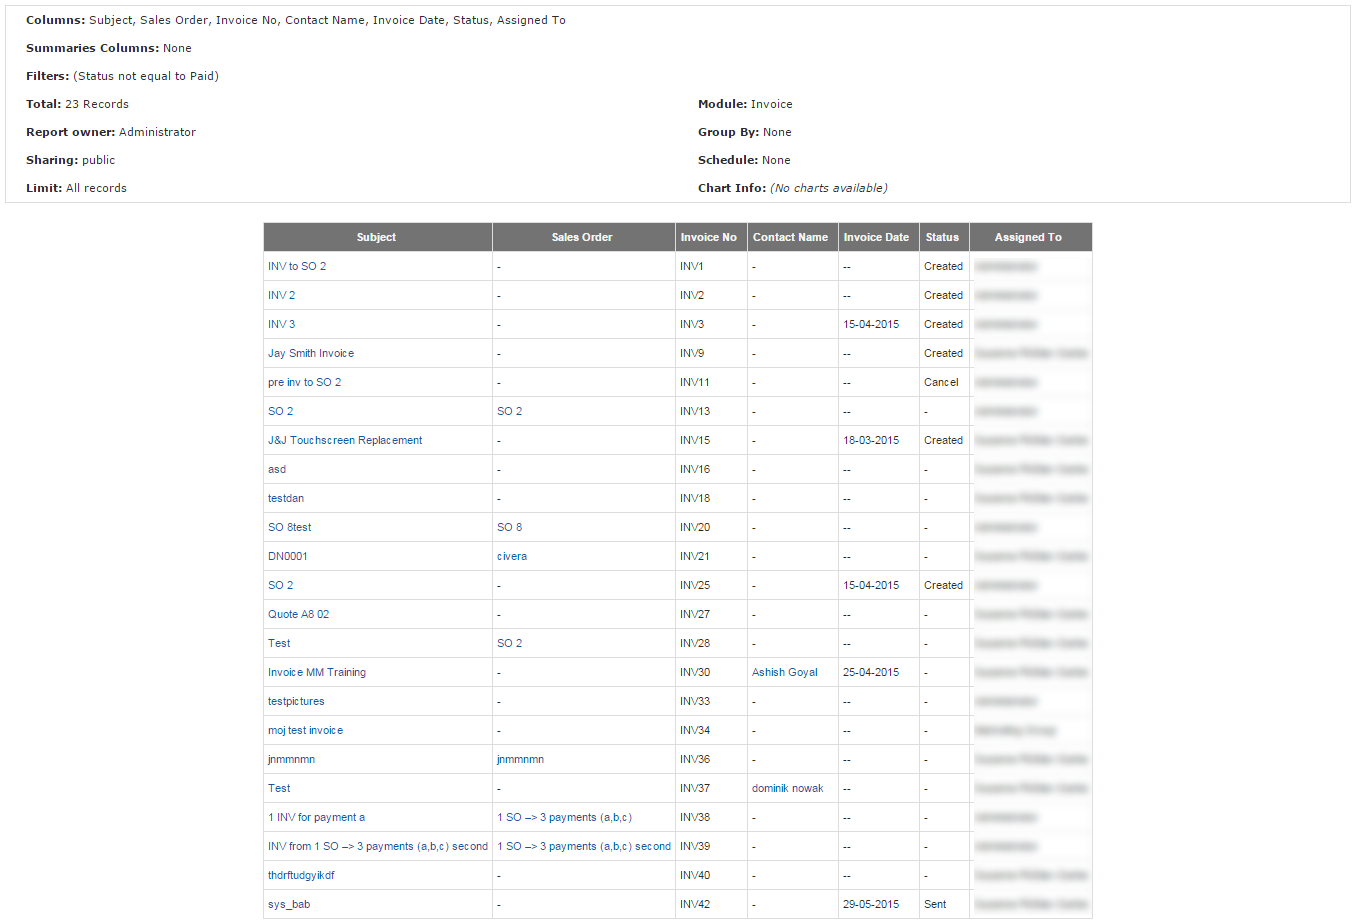
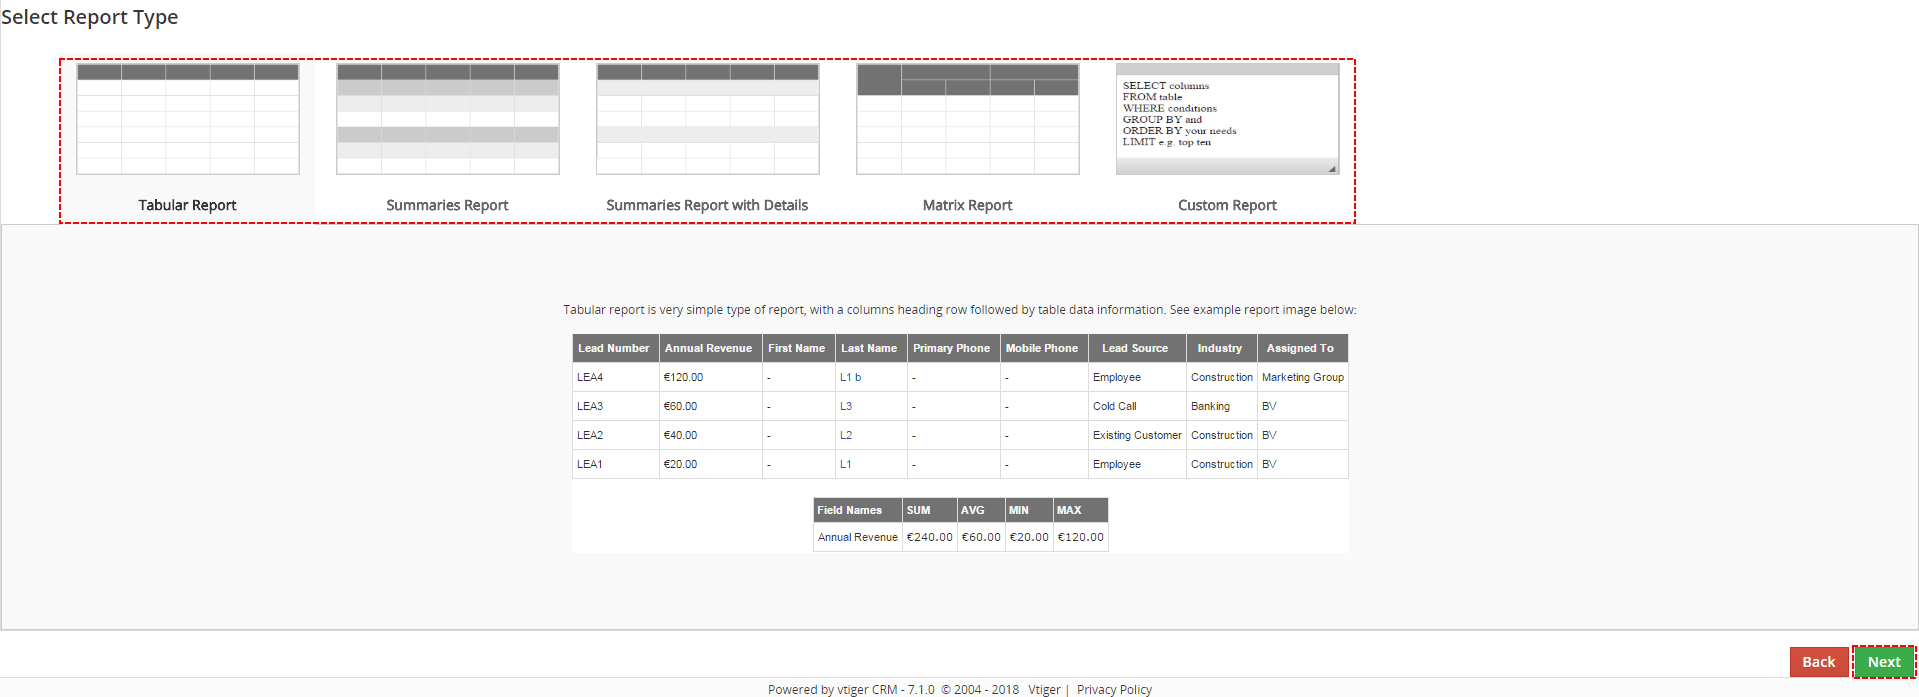
4.1.1.Tabular Report
Tabular report is very simple type of report, with a columns heading row followed by table data information.
4.1.2.Summaries Report
Summaries report is intended to use when performing data calculations grouped by selected columns. Group data choosing rows values by one row or combination (rows-rows), (rows-rows-rows).
Examples:
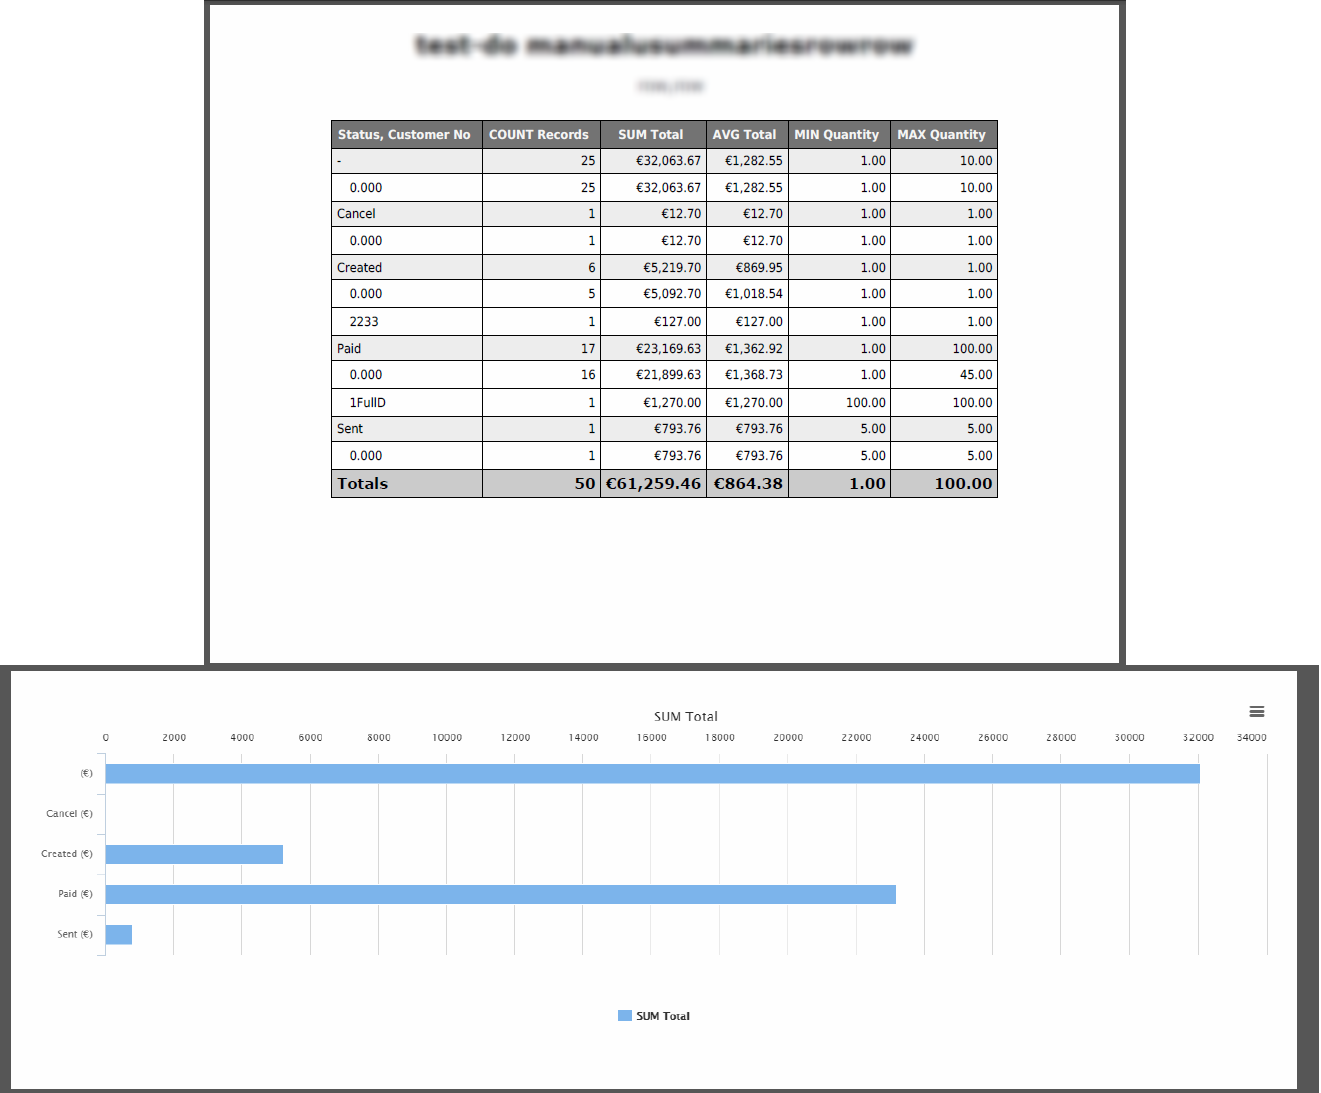
- Report grouped by one row (Invoice status). Summaries columns are COUNT Records, SUM Total, AVG Total, MIN Quantity, MAX Quantity. Filter is not set. Pie Chart (SUM Total).
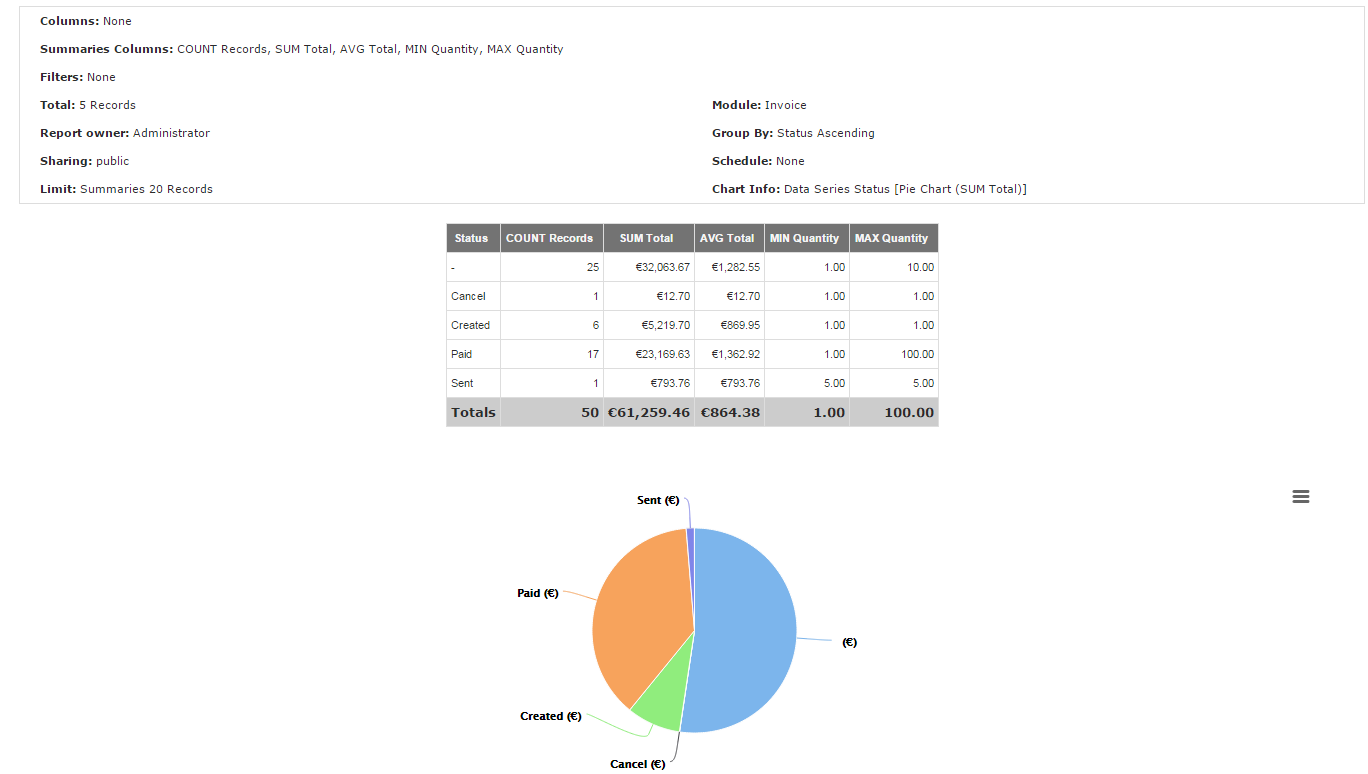
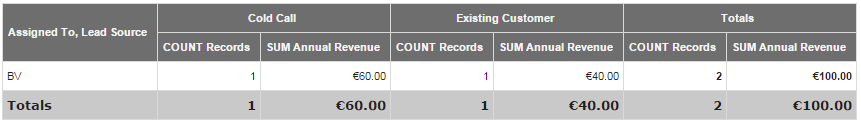
Summaries Report grouped by one row – Reports 4 You Vtiger 7 - Report grouped by two rows (Invoice status, Customer No.). Summaries columns are COUNT Records, SUM Total, AVG Total, MIN Quantity, MAX Quantity. Filter is not set. Horizontal Chart (SUM Total).
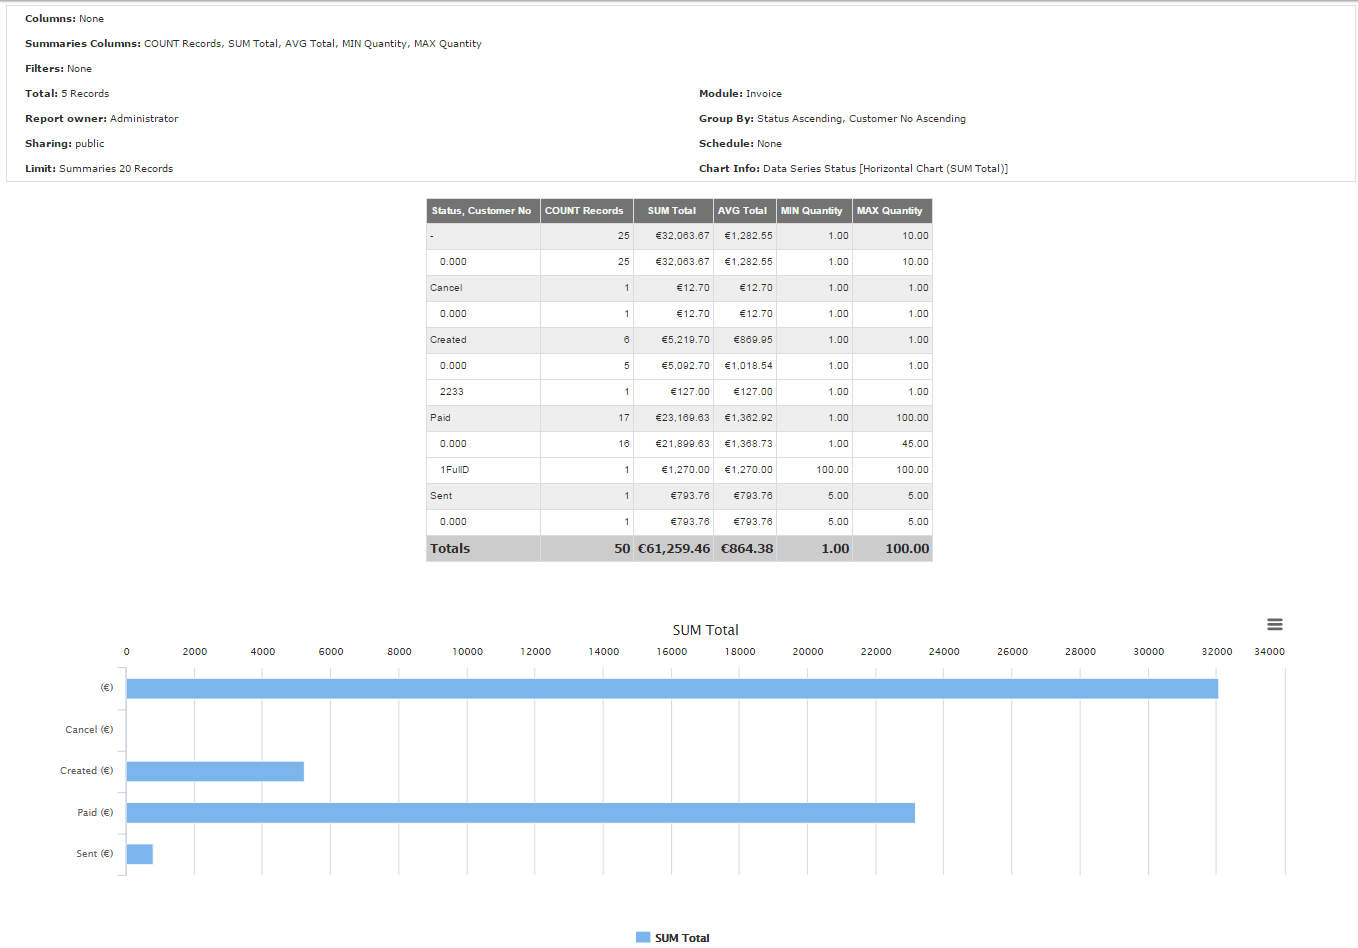
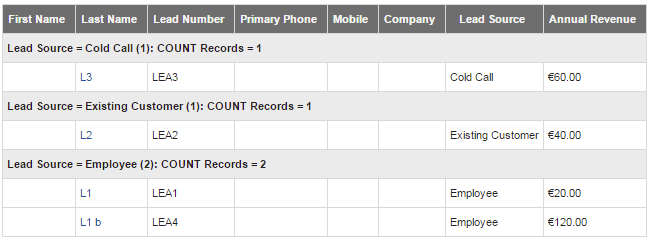
Summaries Report grouped by two rows – Reports 4 You Vtiger 7 - Report grouped by three rows (Invoice status, Contact Name, Invoice Date). Summaries columns are COUNT Records, SUM Total, AVG Total, MIN Quantity, MAX Quantity. Filter is not set. No Chart.
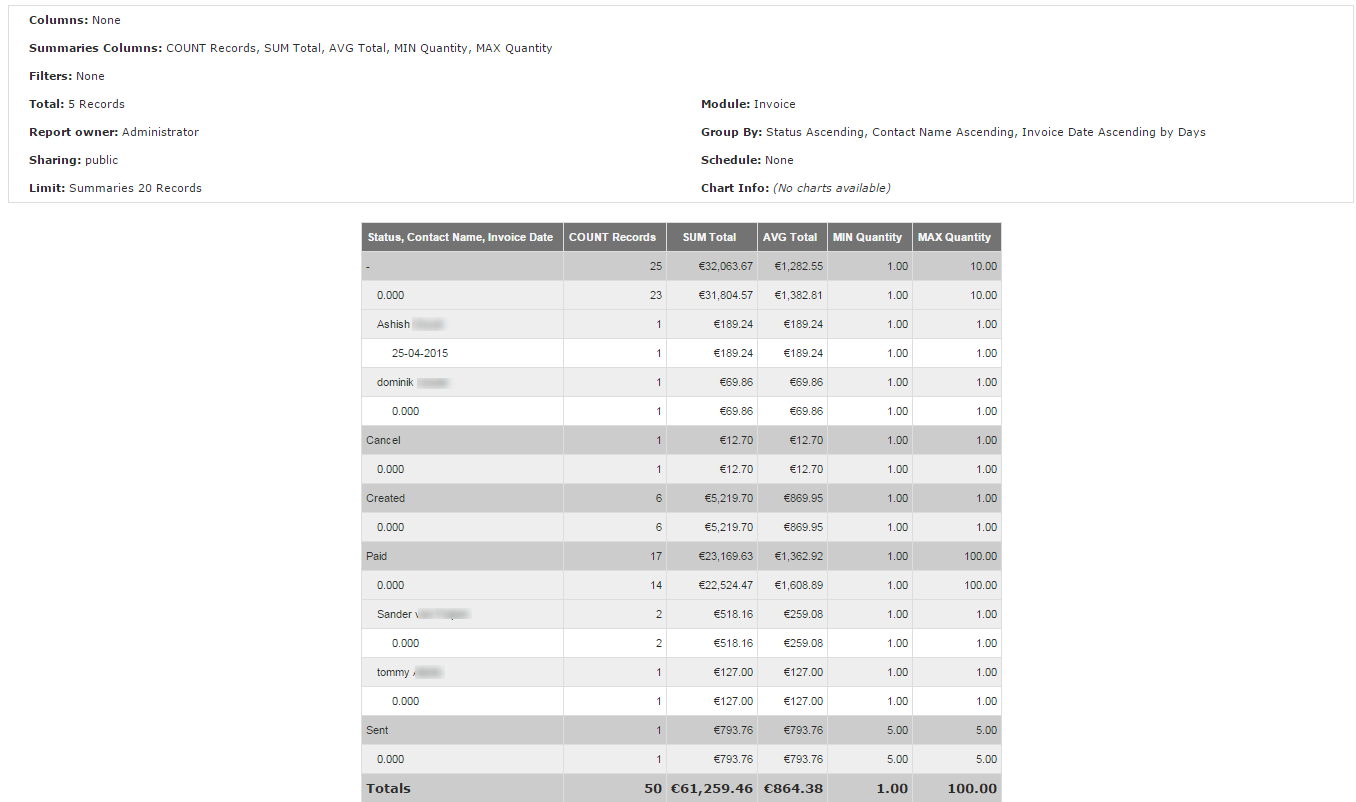
Summaries Report grouped by three row – Reports 4 You Vtiger 7
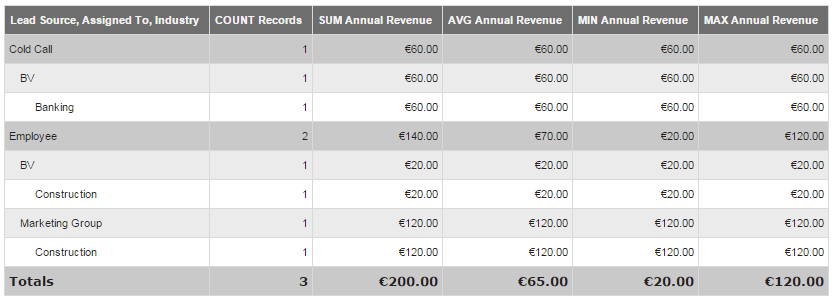
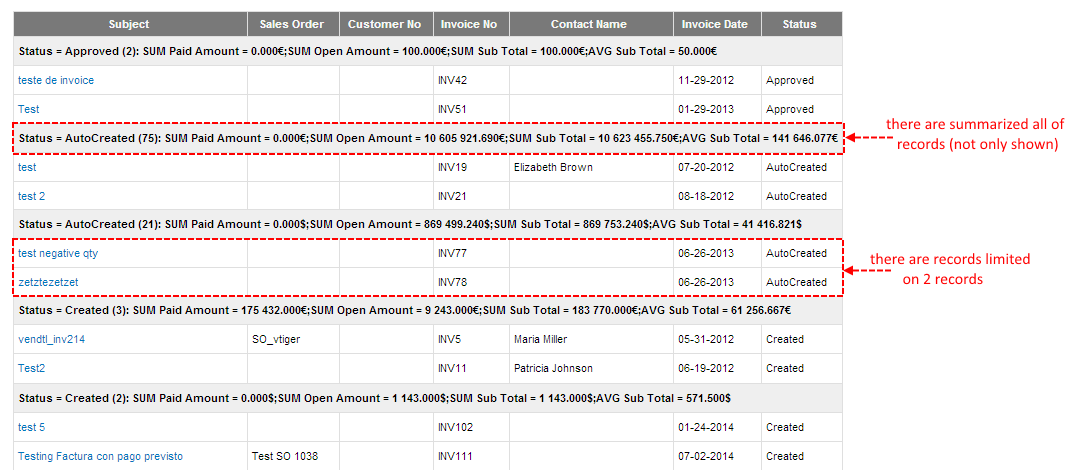
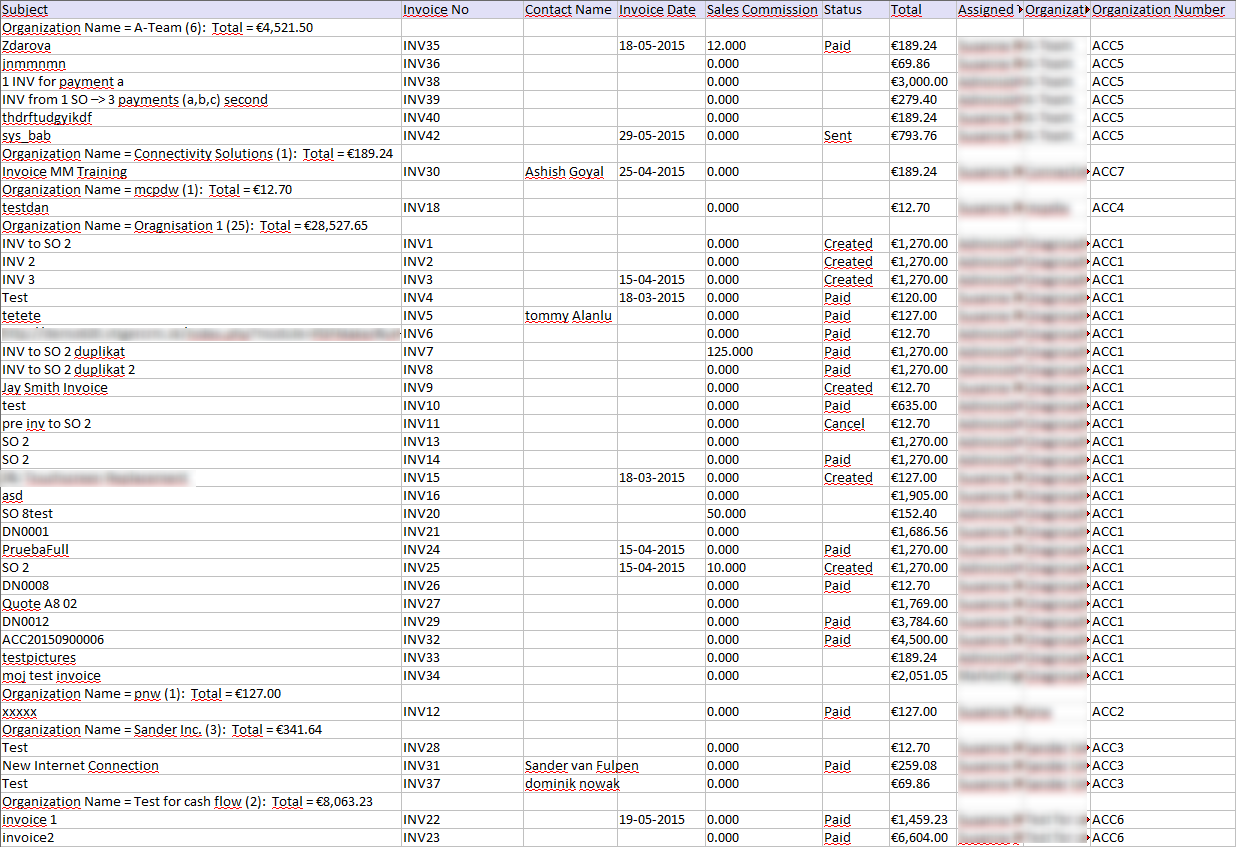
4.1.3.Summaries Report with Details
Summaries report with Details is intended to use when performing data calculations grouped by one selected column with displayed record details. You can define calculations for all report datas and define limited/unlimited count of displayed record details.
Example:
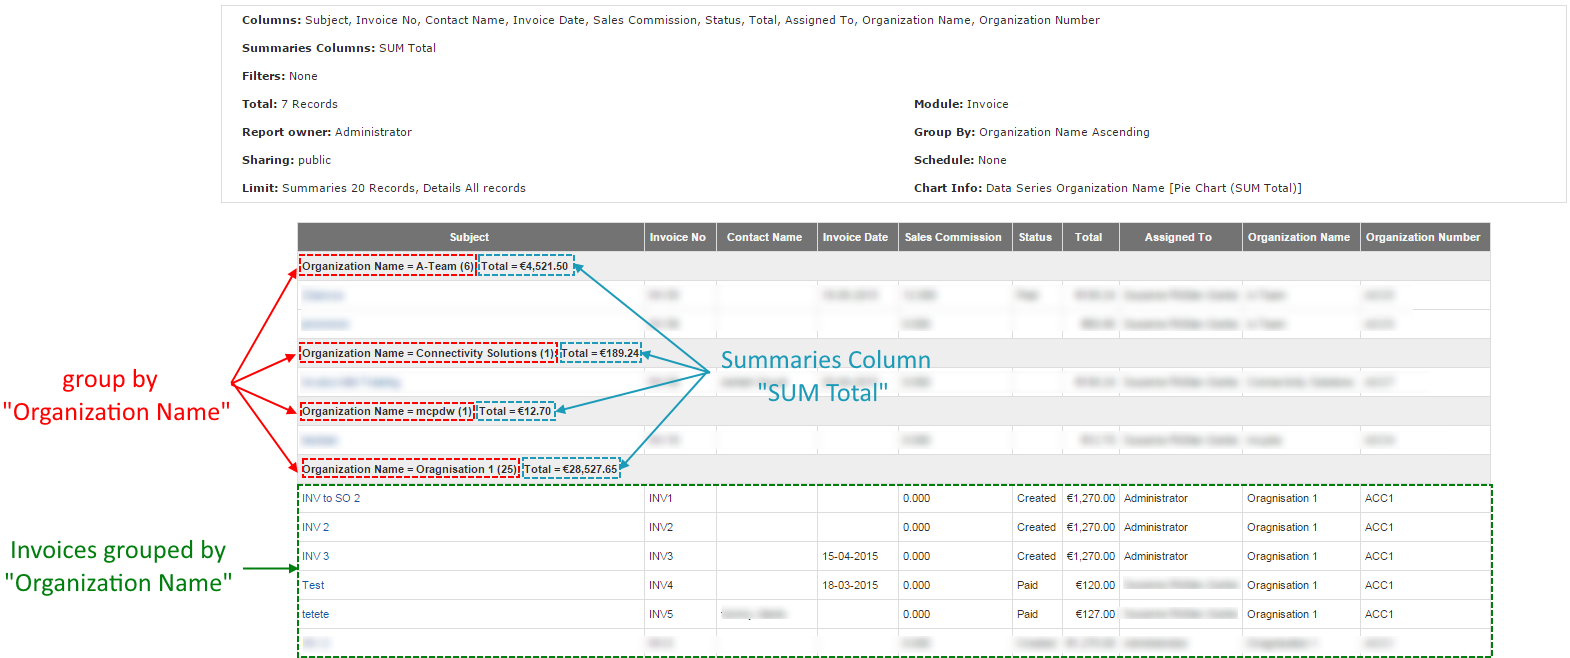
There is Report with details from Invoice module that is group by: Organization Name. Summaries Column is SUM Total. With Columns: Subject, Invoice No, Contact Name, Invoice Date, Sales Commission, Status, Total, Assigned To, Organization Name, Organization No.. Also Chart is included.
4.1.4.Matrix Report
Matrix report is a summaries report with one group column displayed in columns structure. For example COUNT, SUM, AVG, MIN, MAX columns summaries calculated and displayed by date intervals, status, or other column values.
Example:
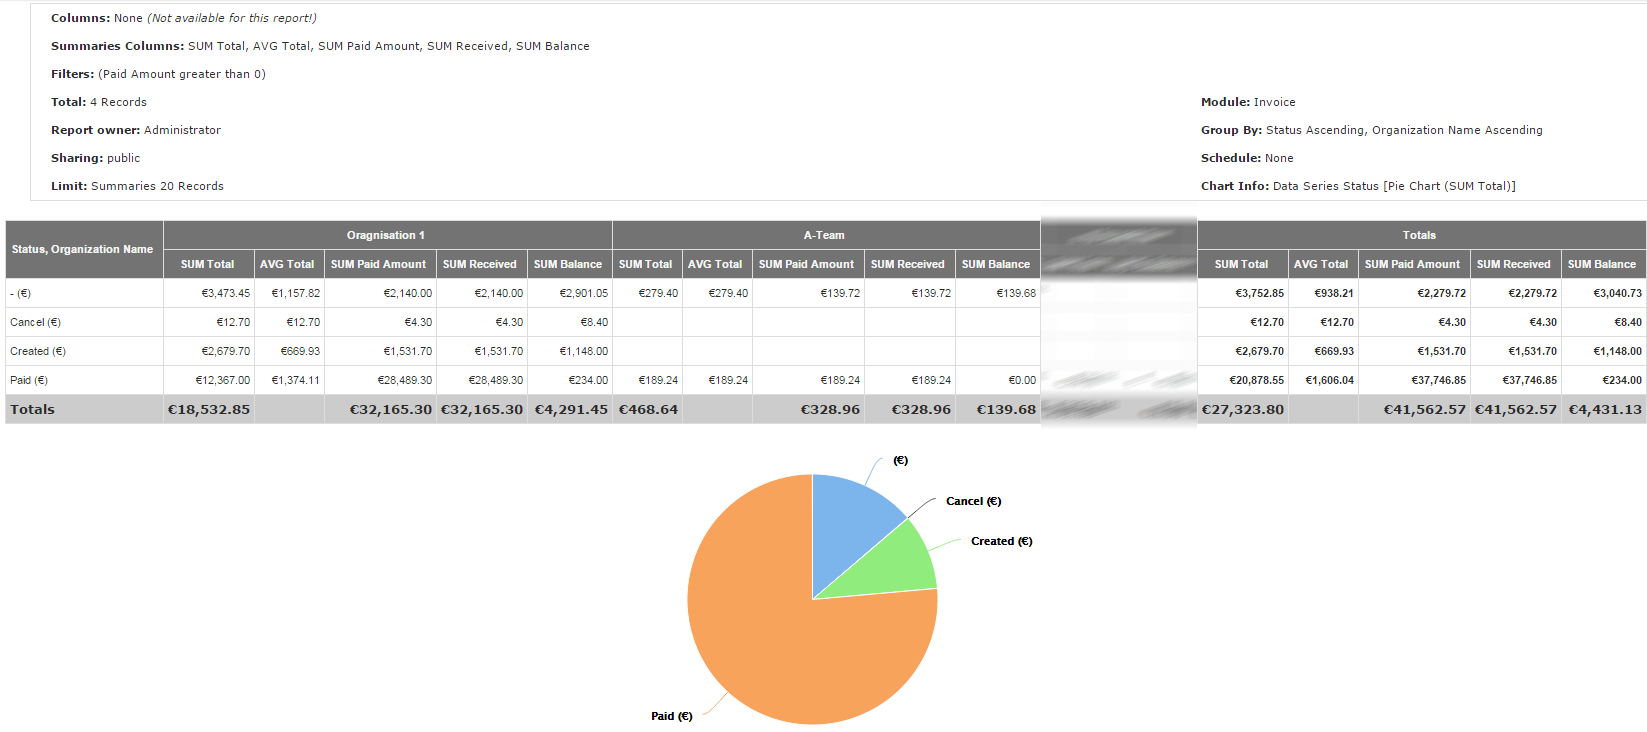
Report is grouped by row: Status and column: Organization Name. With filter: Paid Amount is greater than 0.
4.1.5.Custom Report
Custom report have to be programmed by skilled user with programming experiences. Do not forget that custom SQL Report display Records based on defined SQL query. Keep in your mind to use user permissions queries and share with permitted users only! Take care to be really careful with custom report SQL definitions.
4.2.Create the simple Report
In the following part you can see how to create simple Report.
- Open Reports 4 You ListView
Create simple Report – Reports 4 You Vtiger 7 - Click on button
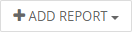 and select your Report type or choose Select type view
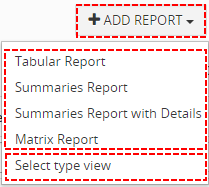
Create simple Report – Reports 4 You Vtiger 7 - If you choose Select type view you can see types with short description. About Report types you can read more: Types of Reports.
Choose Type of Report and click on button.
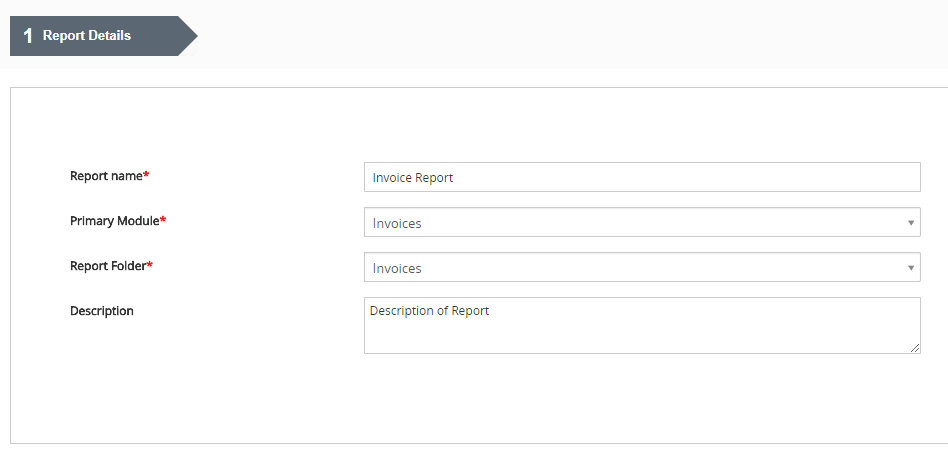
Create simple Report – Reports 4 You Vtiger 7 - Fill name and select primary module and also you can select Folder
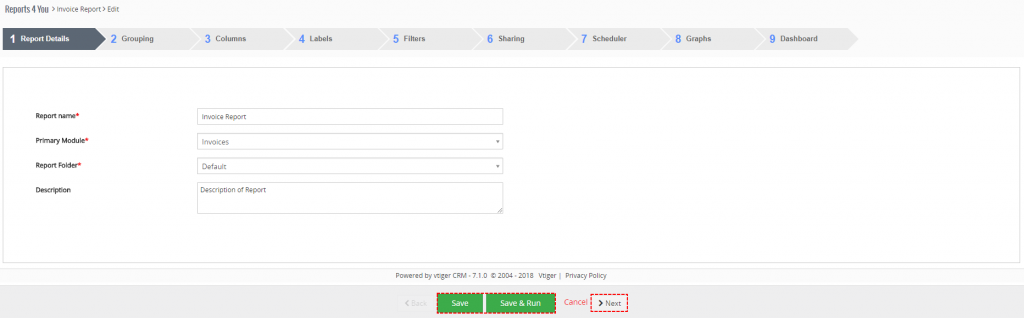
Create simple Report – Reports 4 You Vtiger 7 You have 2 options to pass through Reports 4 You creation:
- With
 button you pass through all possible tabs
 - If you use
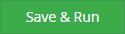 or button, immediately when all required info are filled Report is generated (tabs that are not necessary are skipped)
- With
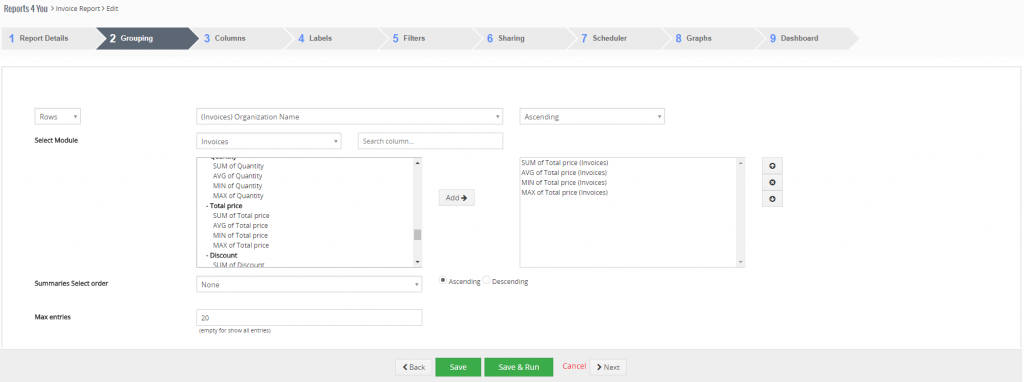
- You can group, select Summaries field and limit and sort
Create simple Report – Reports 4 You Vtiger 7 - Select fields to display in Report
Create simple Report – Reports 4 You Vtiger 7 - You can edit Labels shown in Report
Create simple Report – Reports 4 You Vtiger 7 - You can use filters

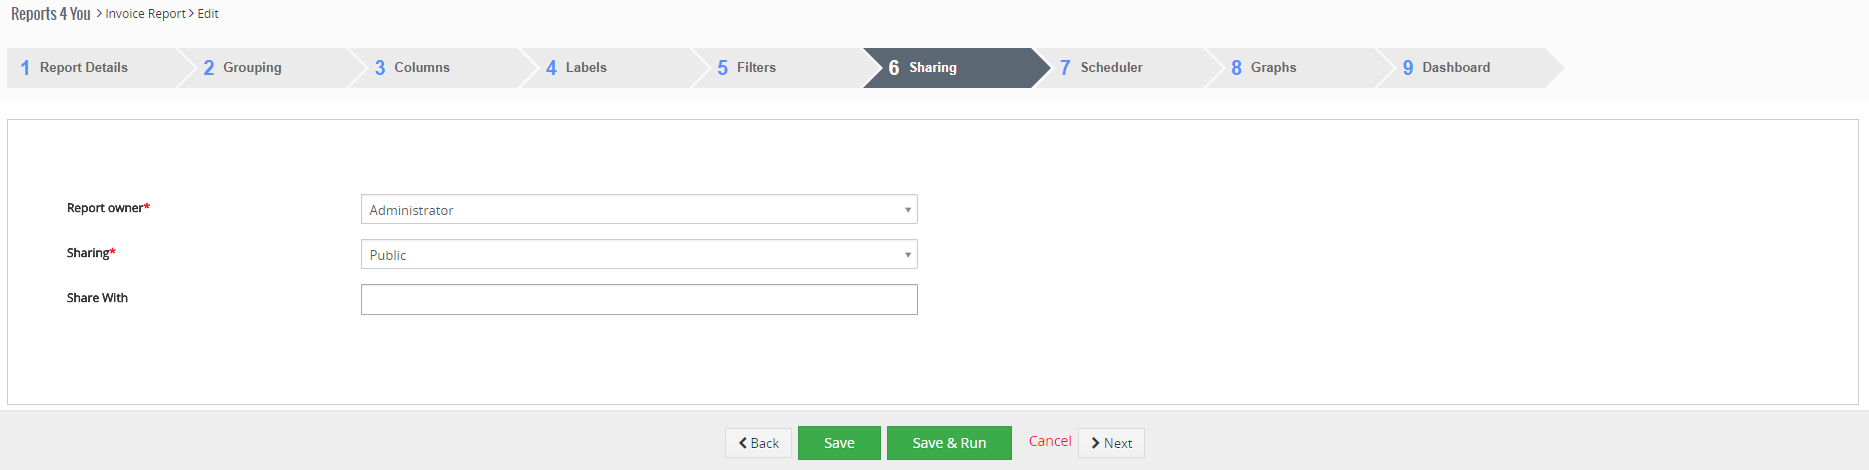
Create simple Report – Reports 4 You Vtiger 7 - Define sharing
Create simple Report – Reports 4 You Vtiger 7 - You can turn on scheduling
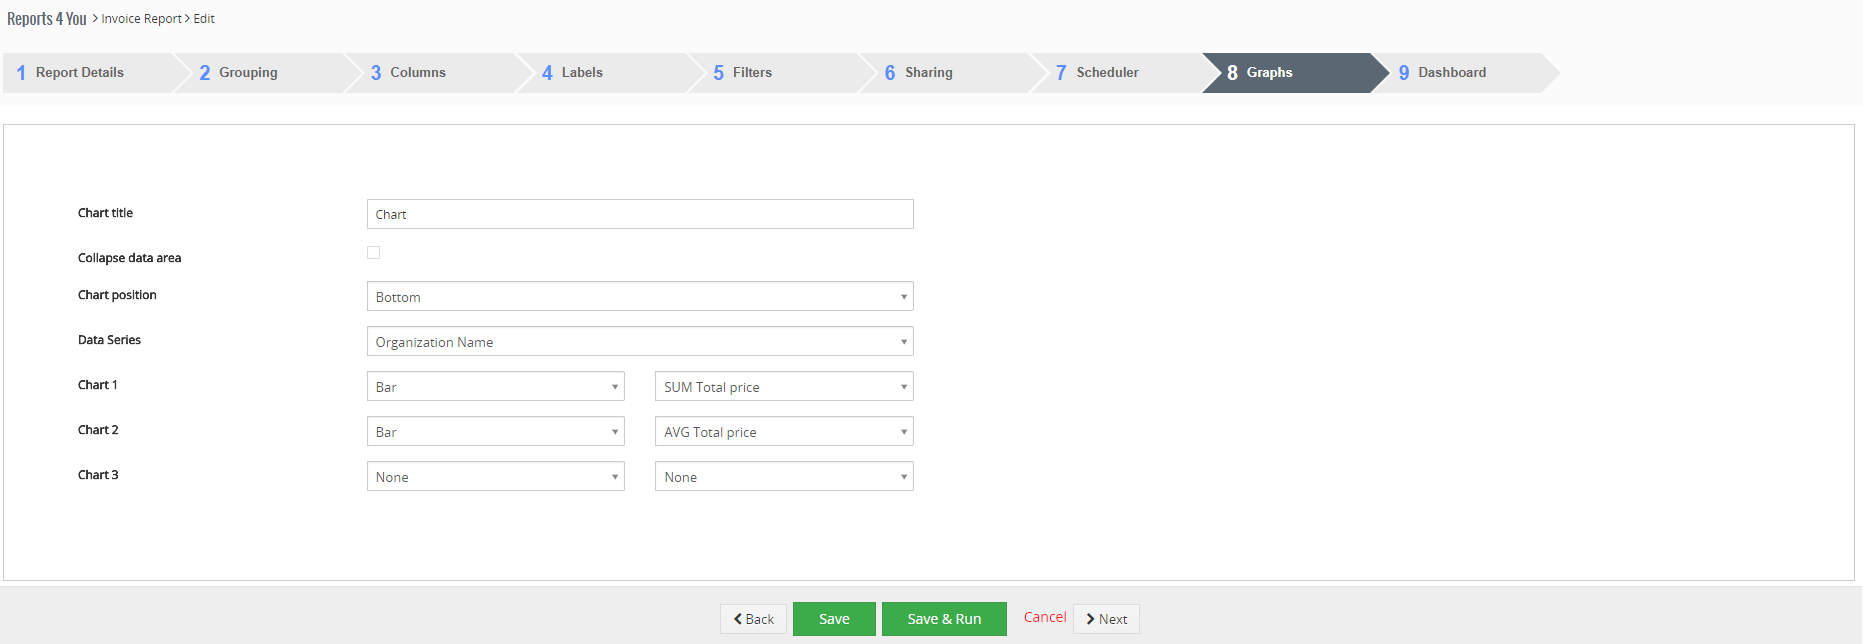
Create simple Report – Reports 4 You Vtiger 7 - If you want to show Graphs you can set it in this tab
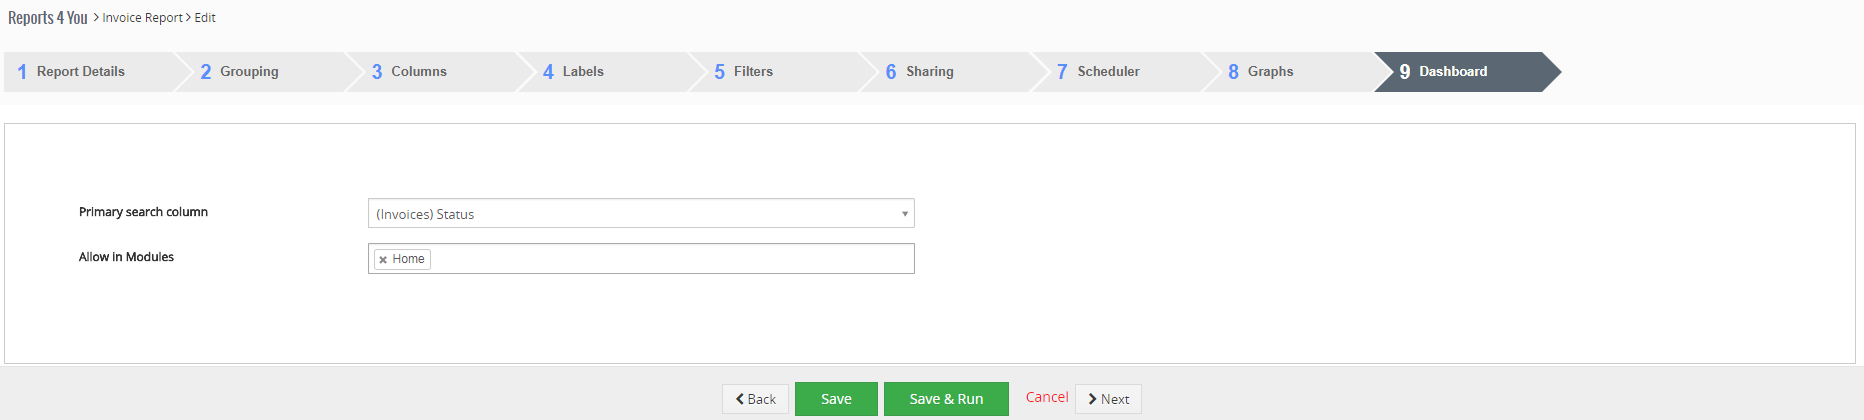
Create simple Report – Reports 4 You Vtiger 7 - In the last step you can create Widget on your Dashboard.

Create simple Report – Reports 4 You Vtiger 7
Then please click on or
or


5.Work area
The Work Area of the Reports 4 You consists of:
- ListView – used for common tasks like add new, edit, duplicate and delete Reports, and access to others tools
- DetailView – shows already created Reports in details
- EditView – allows the preparation of the new report or editing existing reports
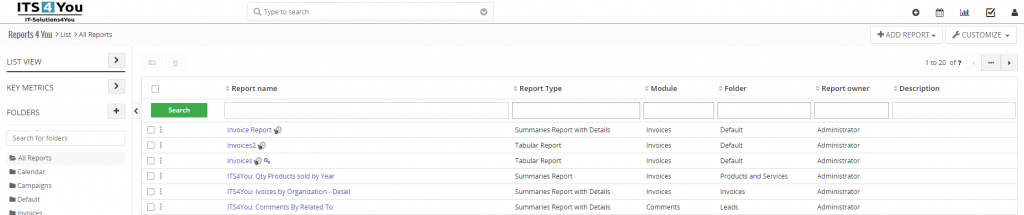
5.1.ListView
The common tasks like add/delete Reports or start editing have to be initiated via Reports 4 You ListView. Go to All → TOOLS → Reports 4 You and Reports 4 You ListView will appear on your screen.
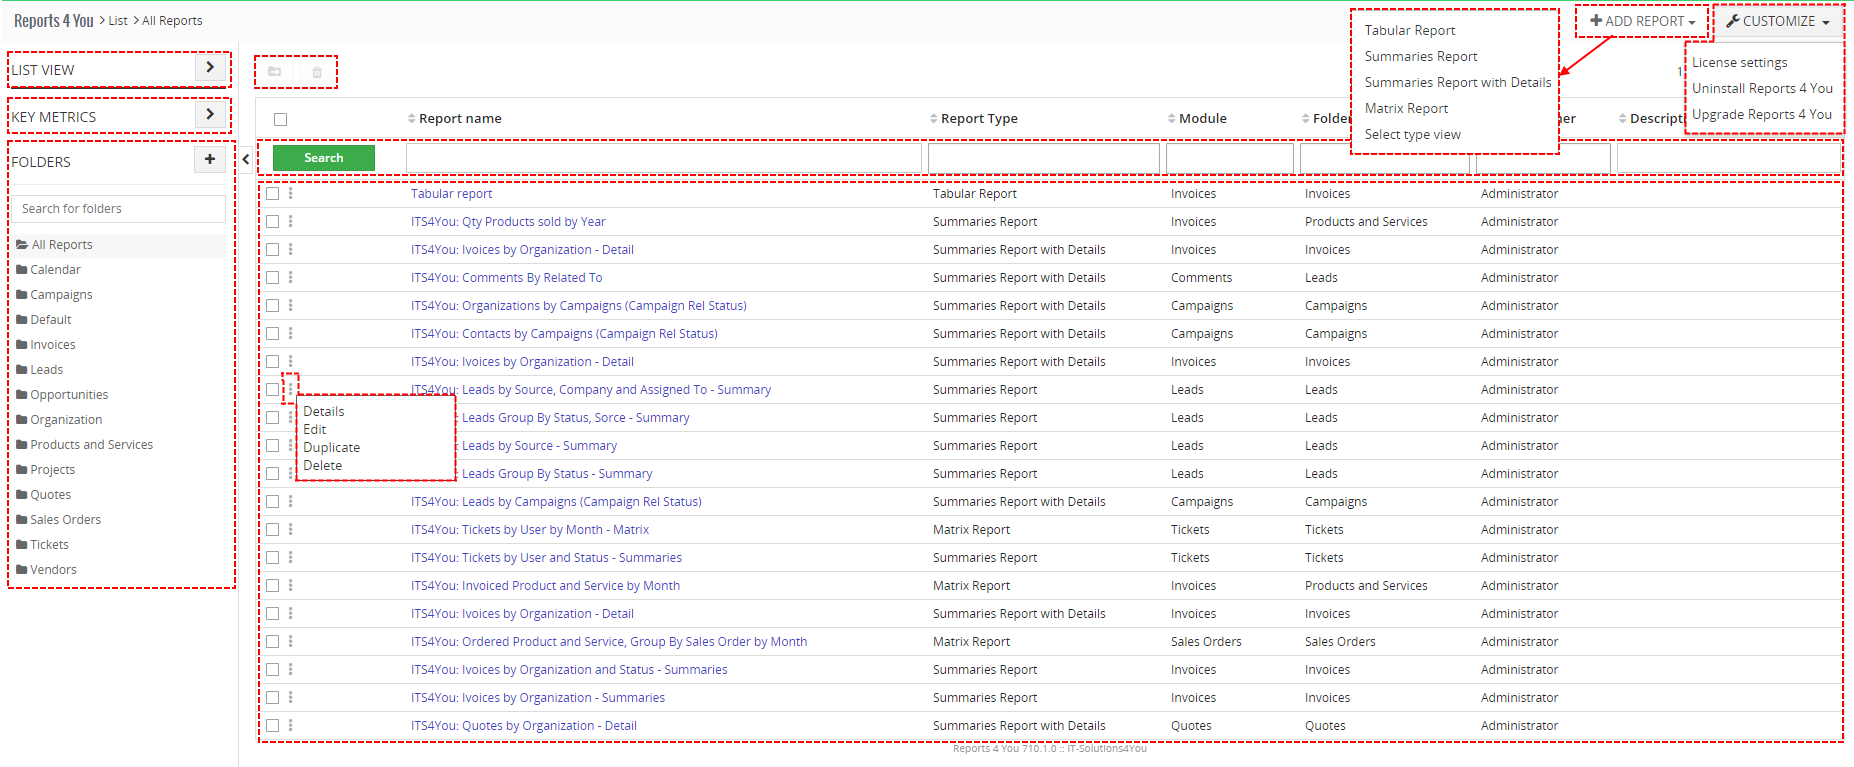
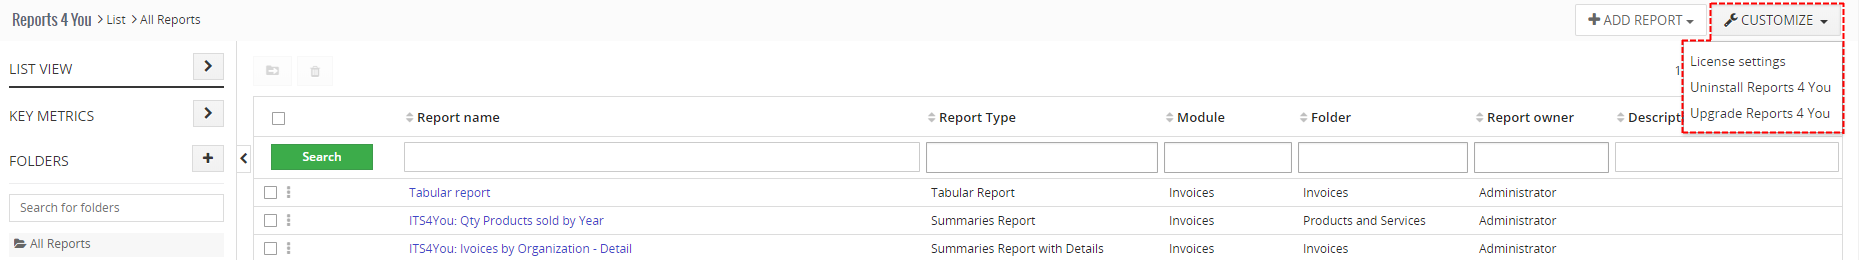
The main part of the Reports 4 You ListView consists of list of the Reports, which gives you information about a Report name, Report Type, Module, Folder Name, Report owner and Description of Report. As shown in the picture, above the list of the reports you can find following:
ListView of Reports 4 You consists of:
 contains actions for switch to DetailView, edit, duplicate or remover Reports
- is used to add new Reports
 is used to add new Folder
 provides options to search your Reports
 next/previous page of Reports
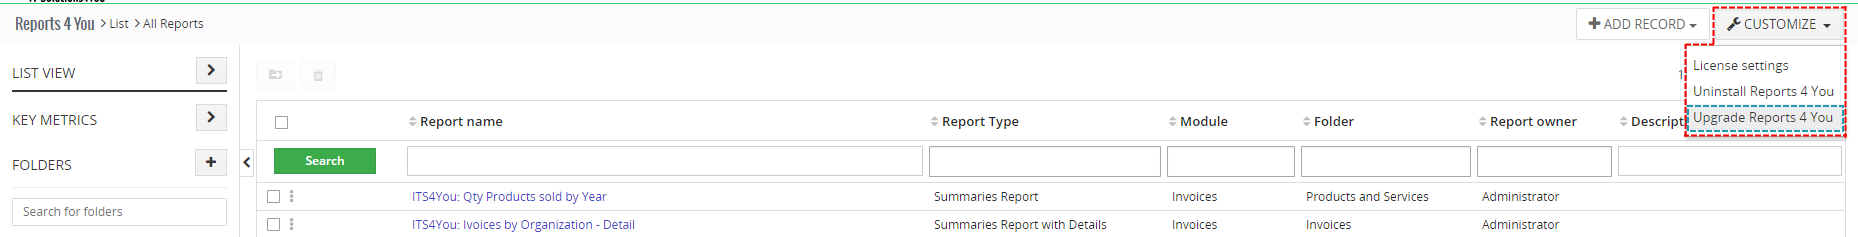
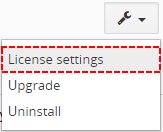
 is used for License setting, Uninstall and Upgrade option
 to move or delete Reports
 open ListView of Key Metrics (read more about Key Metrics)
5.2.DetailView
From ListView you can directly open any Reports 4 You in DetailView.

The DetailView consists of:
- Report details part
- Information Block
- Data Block
- Chart part
- Report filters part
- Group of action buttons
 open EditView of Report
 to duplicate Report
 allow to print Report
 allow to export your Report to Excel format
 allow to export your Report to PDF file
 generate your Report again
 show/hide Filter options
 show/hide Report Information Block
 Show Data
 to save Report
5.3.EditView
The EditView shown in the picture below allows the preparation of the new Report or editing existing Reports. The main utilization of the EditView is in the additional correction of the Report. The EditView is divided into three parts:
- Tabs of Report – here you can select which part of Report you want to edit
- Buttons parts – there are buttons: Cancel, Save, Save & Run, Back/Next tab
- Box of tab´s option – here you can edit your Report
EditView consists of 12 tabs (some are available only for specific type of Report):
- Select Report Type
- Report Details
- Report SQL
- Grouping
- Columns
- Calculations
- Labels
- Filters
- Sharing
- Scheduler
- Graphs
- Dashboard
5.3.1.Select Report Type
Now, you can choose type of Report you want to create and click on . To see differences between types of Reports please check chapter Types of Reports.
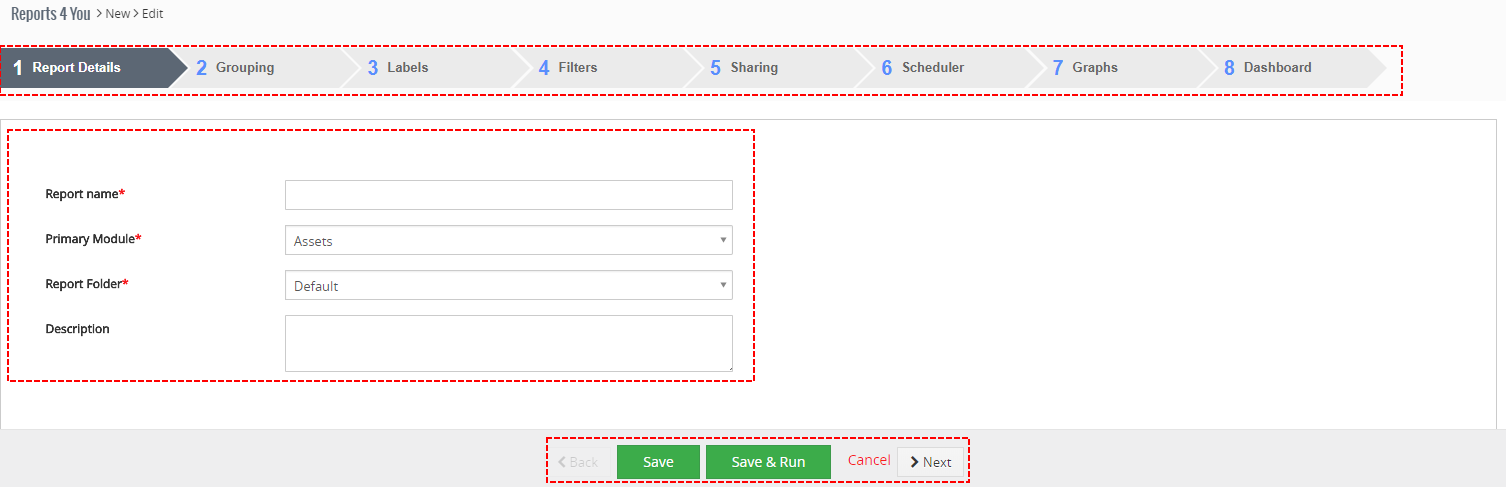
5.3.2.Report Details
In Report Details, you will have to provide basic Report information.
| Name | Description |
|---|---|
| Report Name | Name of your Report |
| Primary Module | Module from which you want to create Report (After first module selection you will be not allowed to change it) |
| Report Folder | Folder which will contain Report |
| Description | Description of Report |
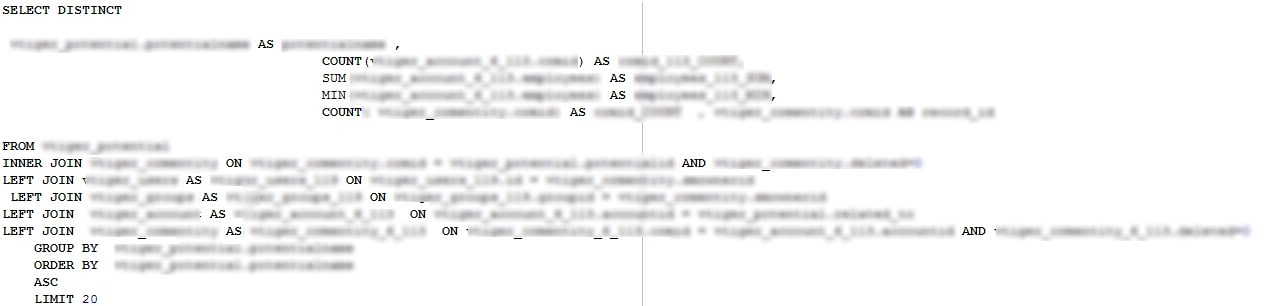
5.3.3.Report SQL
Report SQL is available only for Custom SQL Report.
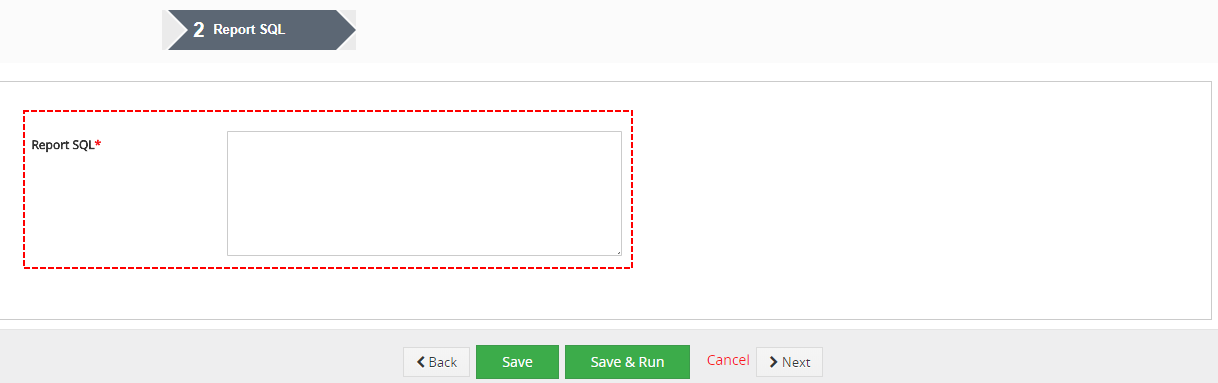
| Name | Description |
|---|---|
| Report SQL * | Place for your custom SQL |
5.3.4.Grouping
This step provide in case you want to Summaries Report, Summaries with details and Matrix Report.
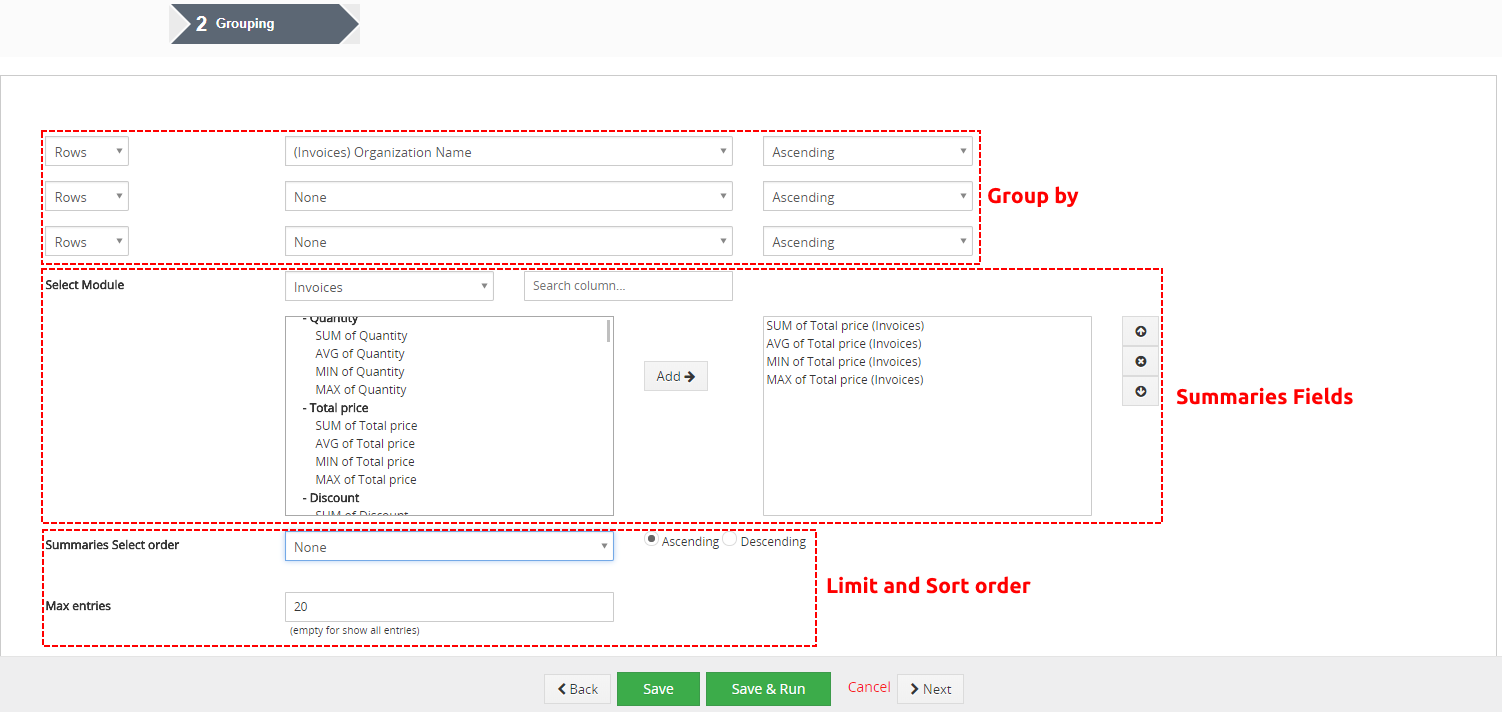
Group by
here you can define by which fields will be your Report grouped. You are able to choose other fields to group by. There are two option (Rows or Columns). Columns you can choose if you select Matrix Report. You can also define how should be your Report ordered (Ascending/Descending).
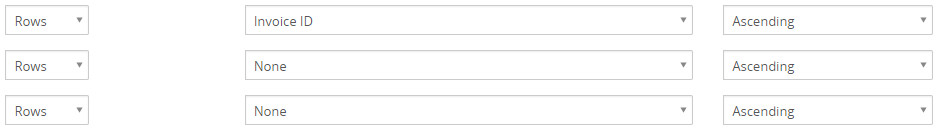
There is also good option to choose date and group by date based on days, weeks, months, quarters, half years and years.

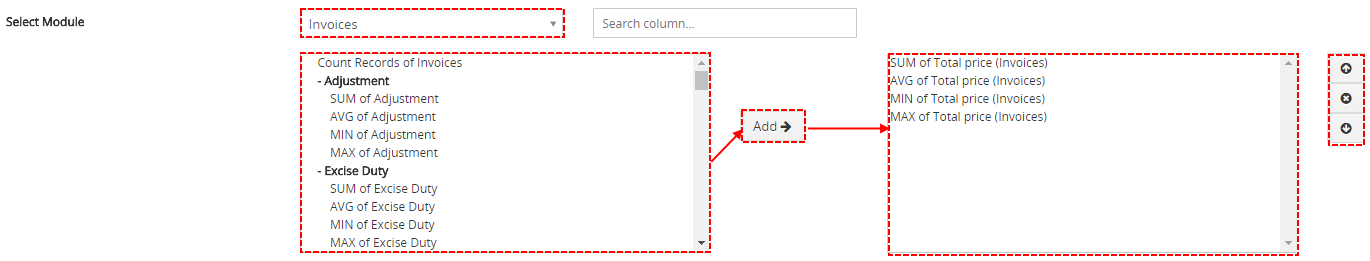
Summaries Fields
You can show SUM, AVG, Min, Max of Available Summaries Fields.
Limit and Sort order
allows you to limit and order grouping records.
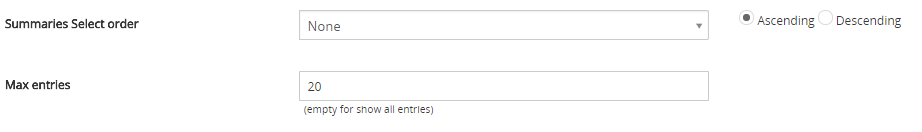
Here you can see how to looks like if you have Limit set on e.g. 3. If you want to limit number of record set limit also in Select Columns part.

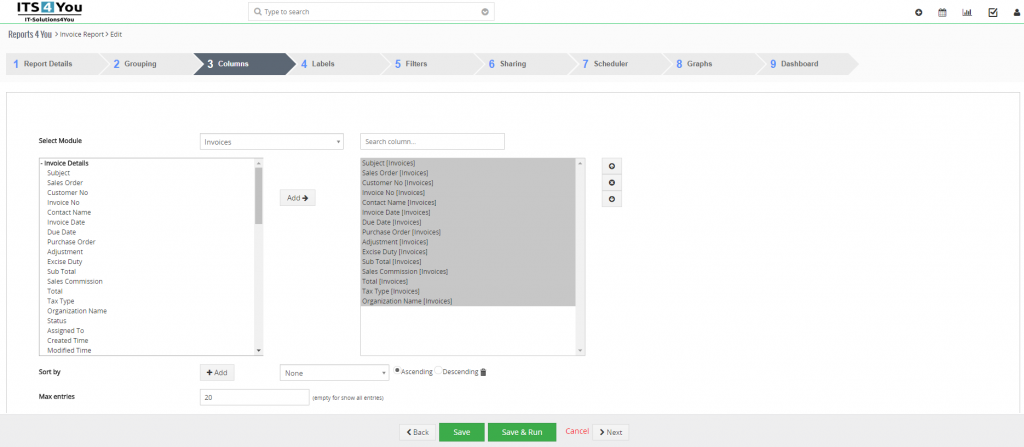
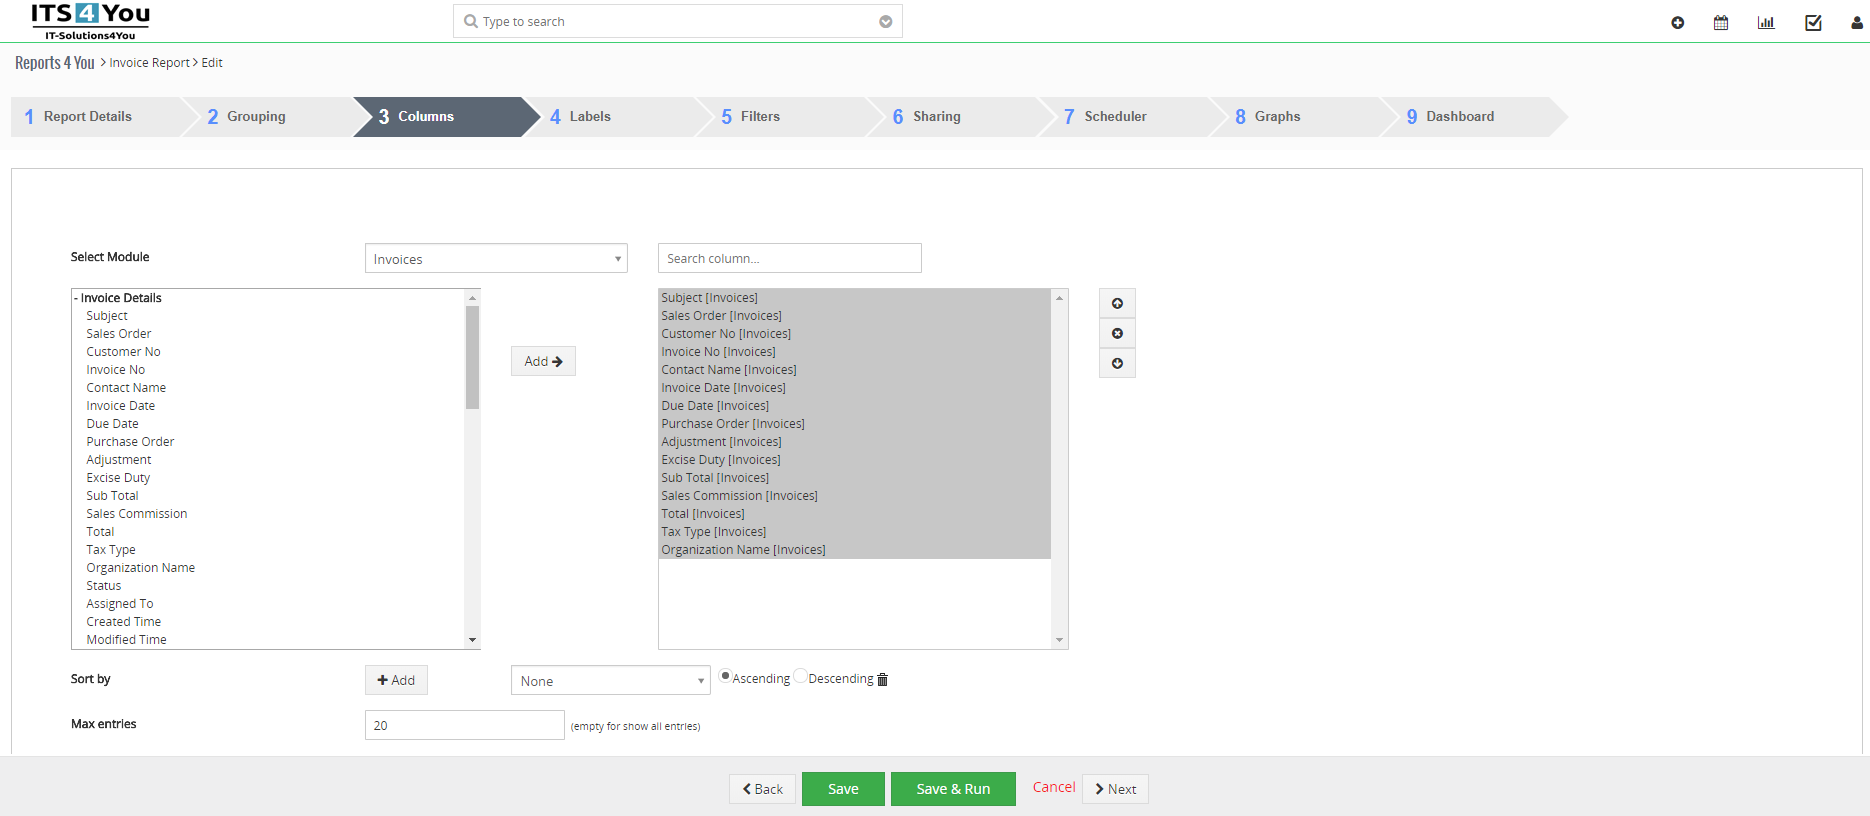
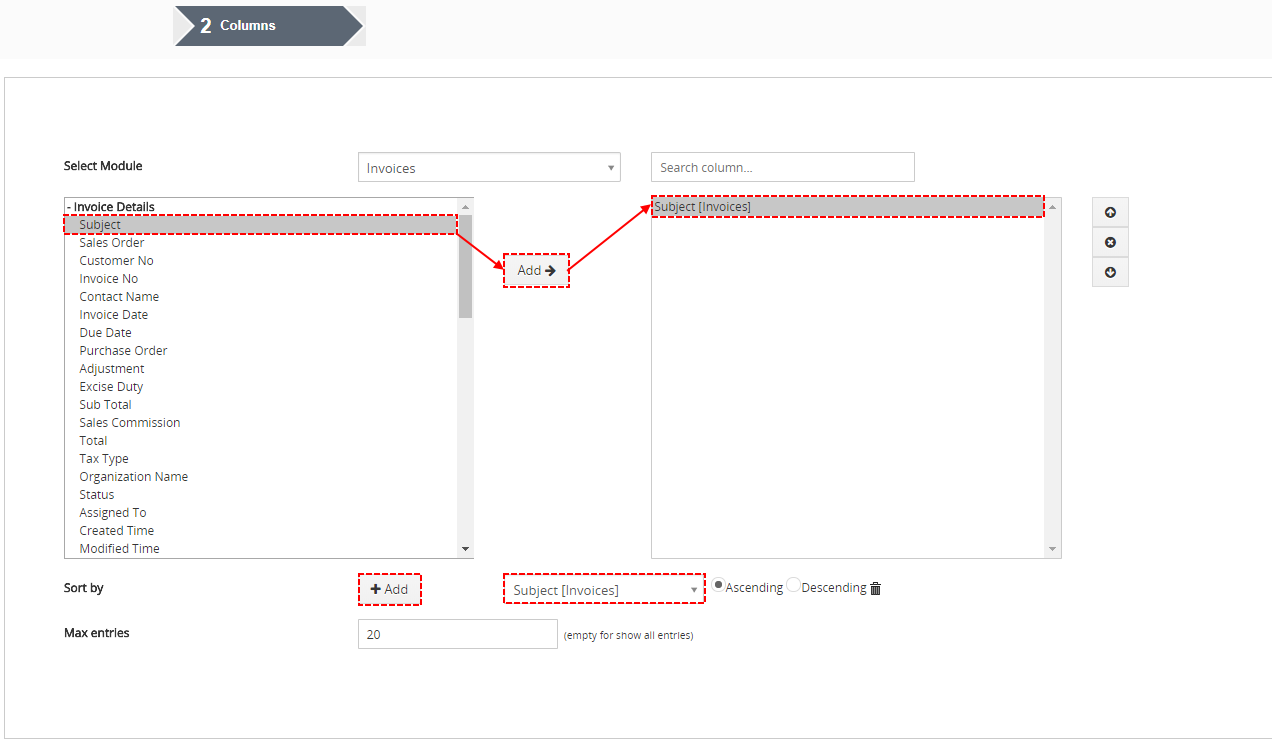
5.3.5.Columns
You can use it in Tabular report and Summaries Report with details.
In this step, you can select the fields to display in report with details. These fields can be selected from the Report module selected in Report Details and its related modules. Please choose one of available module from “Select Module” options and for easy navigation write part of field name in search input box. Limit and Sort order block allows you to limits and order detailed records. There is also option to sort by more then One Column.
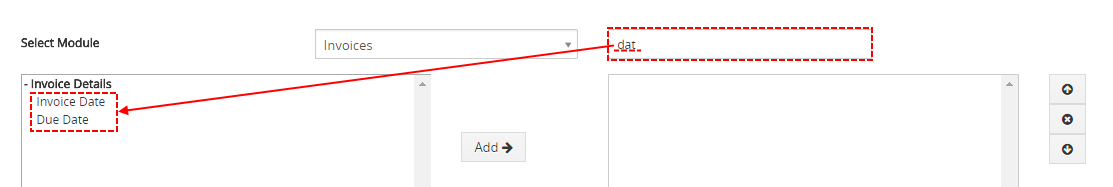
There is also useful option to search fields from chosen and related modules, choosing module and typing name of field.
There is also Limit and Sort order, here you can set how many records are shown. For example, limit is set on 2:

5.3.6.Calculations
Now, you can select the calculations for the fields available across the Report modules and only in Tabular Report. You can select the calculations like SUM, AVG, MIN and MAX values (Numeric Columns: Sub Total, Total, …) across the Report result records.

In Custom Calculation you can define expression of custom calculations based on fields available across the Report modules. You can define basic mathematical operations like: + , – , * , / or some other expressions: if … then … else … end (==,<=,>=,<,>) concat( … , … ).
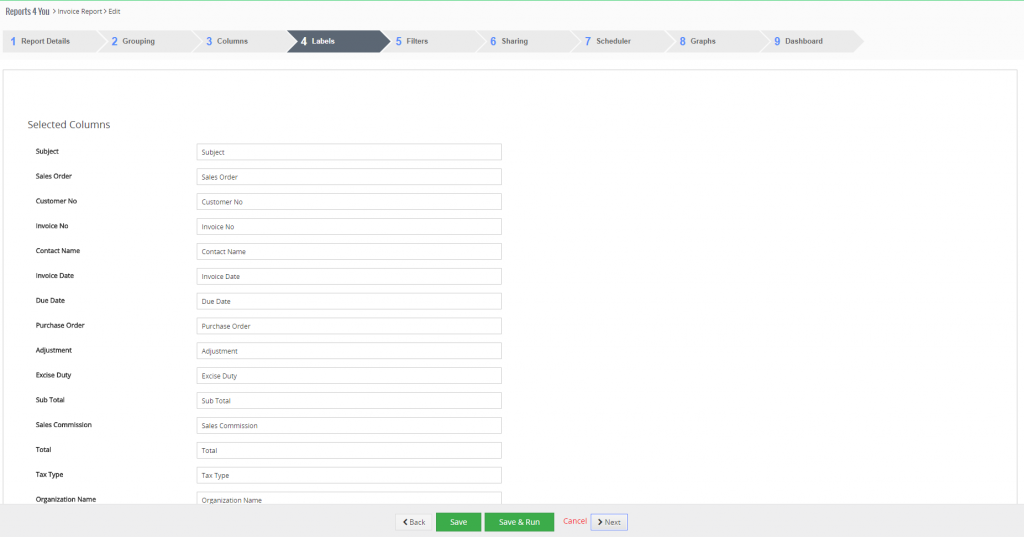
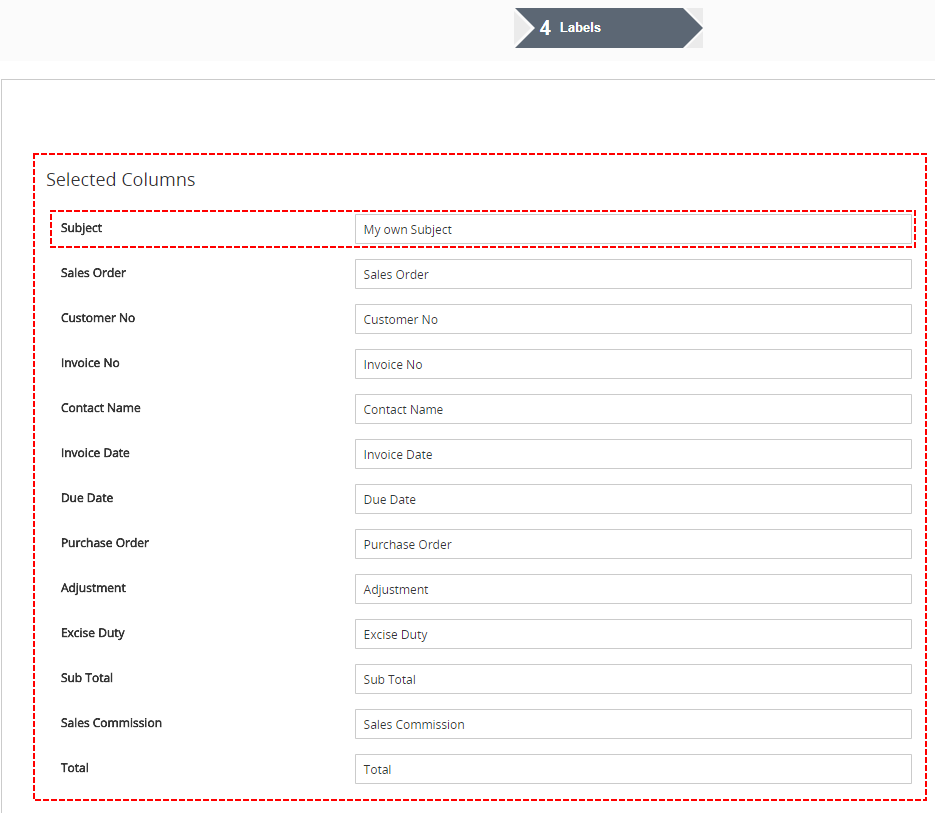
5.3.7.Labels
This step gives you the flexibility to customize selected field labels. You can rename Selected Columns how you want.
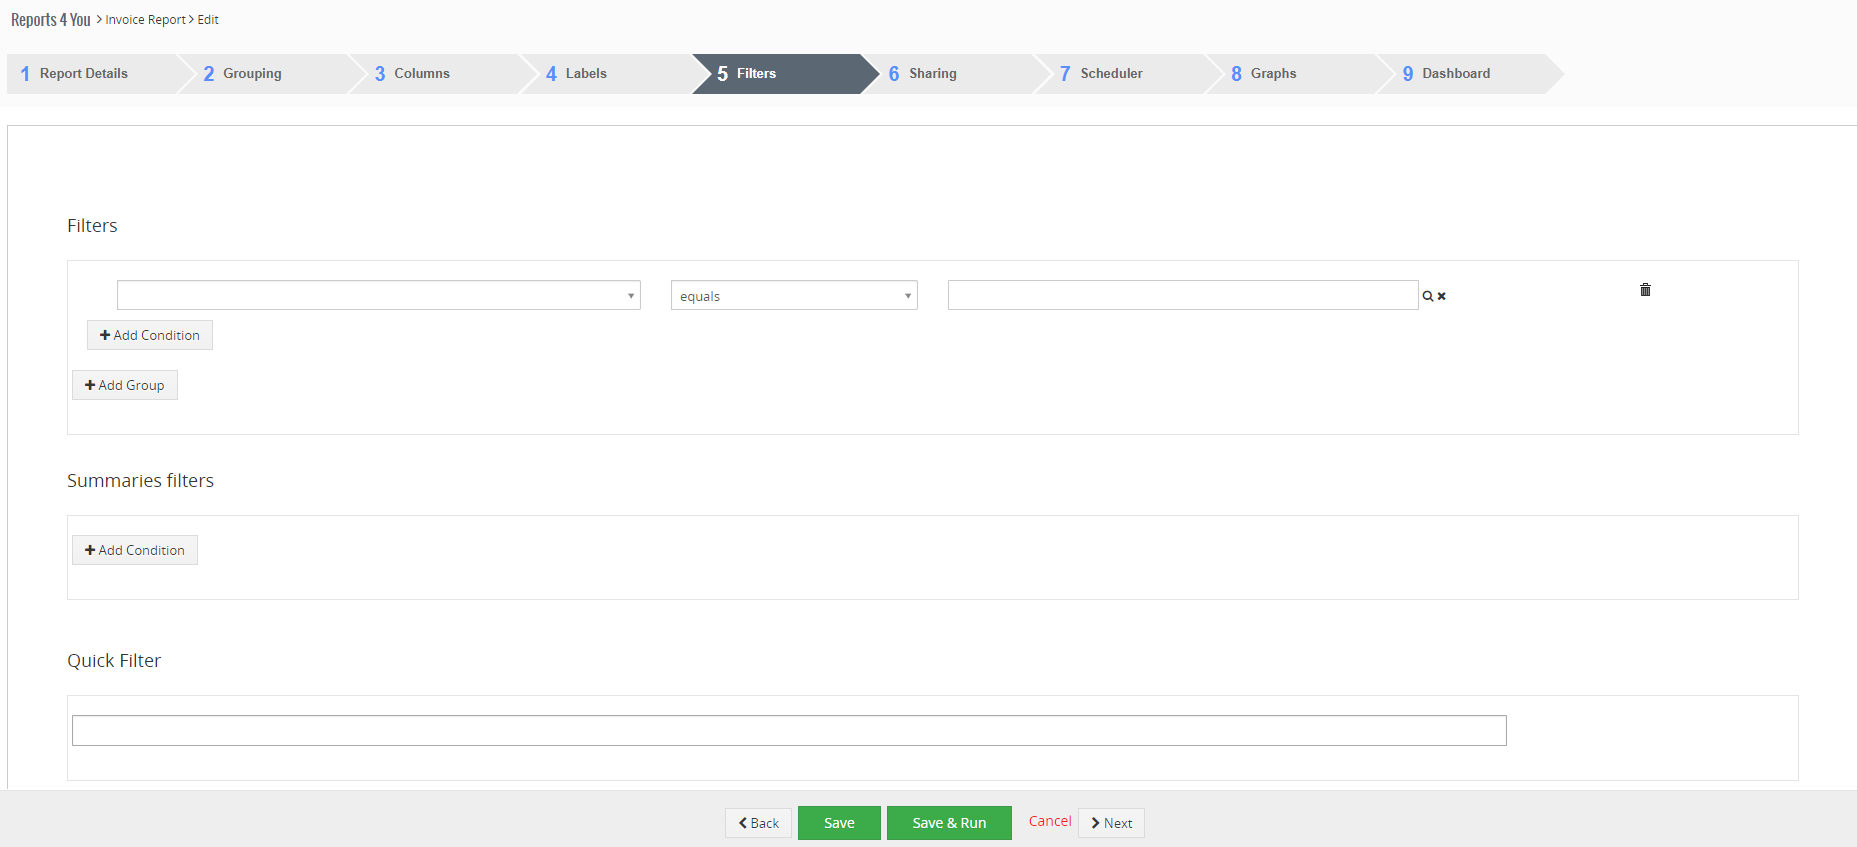
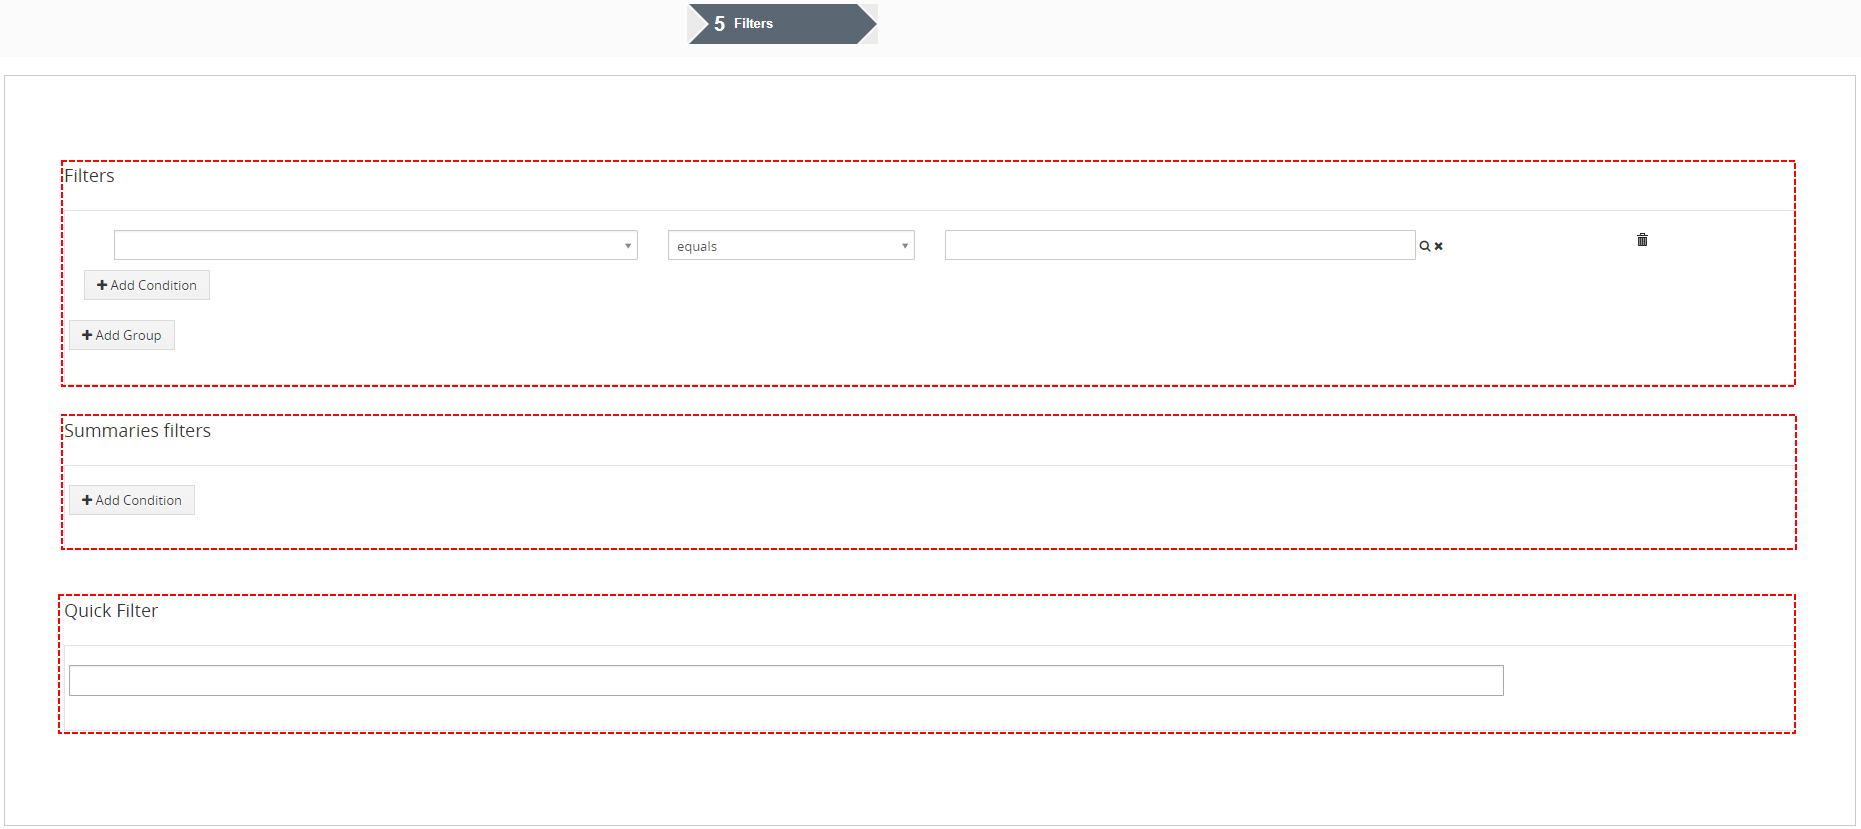
5.3.8.Filters
In this part, you can specify the conditions to filter the results in a report. You are able to specify conditions in Filters and Summaries Filters. Filters have all the fields from the selected module and its related modules where the comparator and condition can be chosen based on type of field selected. You are allowed to provide unlimited number of conditions, we recommend 5 conditions.
- Filters – here you are able to create Filter, add new Condition to Filter
 or add New Group of Filters
  . Course, there are options to Delete Condition
  as well as Group
  . It is good to note our better comparators for time Columns (e.g. Less then today, More then today,Older than … day,…) and repair some standard comparators(e.g. Last/Next Days N,…). (For example you can use it to Report Invoices that are not paid more then 7,… days). Reports 4 You also allows you to compare 2 variables like (Invoice Date greater then field is Due Date)
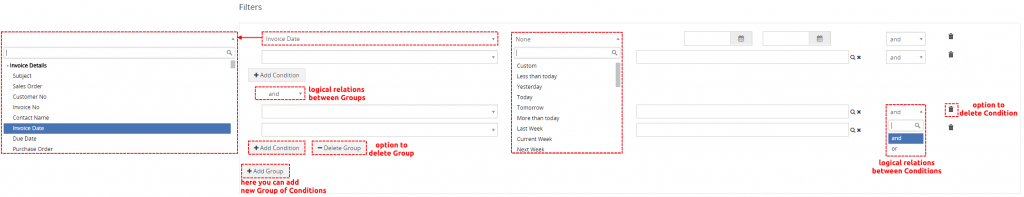
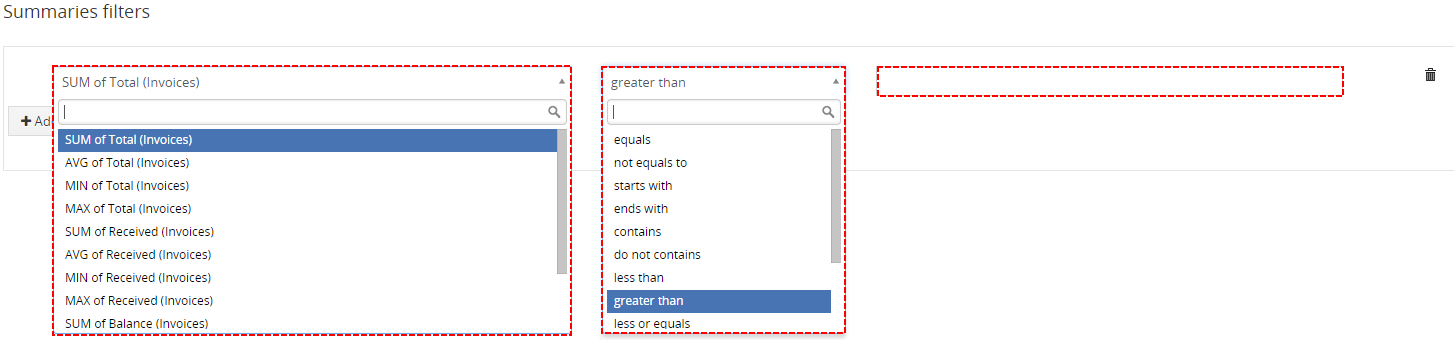
Filters – Reports 4 You Vtiger 7 - Summaries filters – powerful option to create Filters from Summaries fields

Summaries Filters – Reports 4 You Vtiger 7 - Quick Filter – useful ability to edit quick filter in DetailView of Report
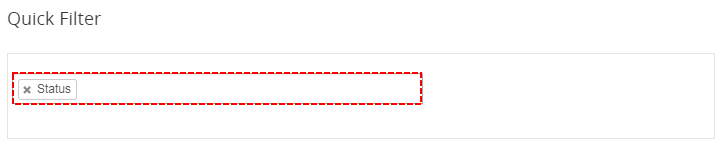
Quick Filter – Reports 4 You Vtiger 7

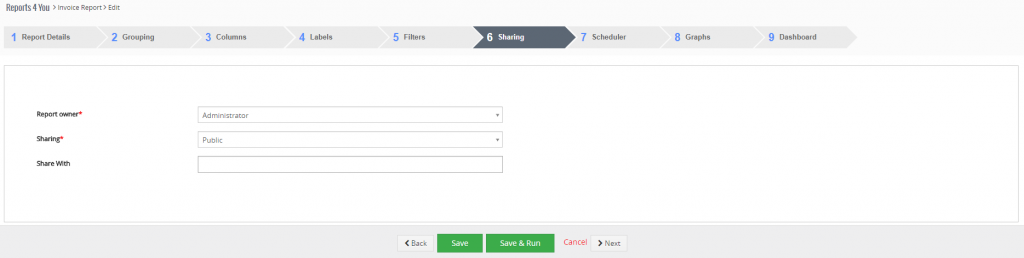
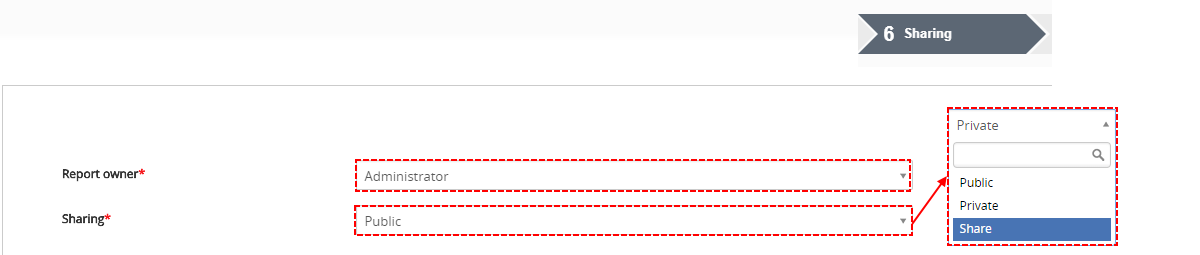
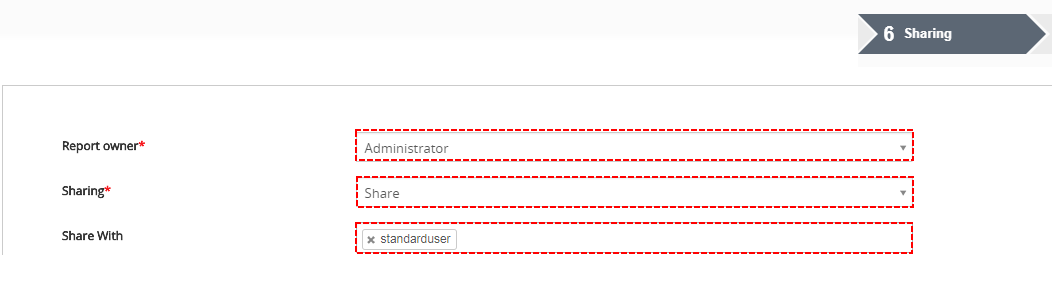
5.3.9.Sharing
In Sharing part, you can specify the security of the report. Here you can select report Owner and the type of report Sharing Rules (Public, Private or Share) across users in role hierarchy. Report can only be edited by Owner and other users whose roles is higher to the role of Owner.
There is also option to setup default sharing options for all created reports.
In the list view of Reports module, click on the button ![]() and select “Settings”, the Sharing settings window will pop-up, see below:
and select “Settings”, the Sharing settings window will pop-up, see below:
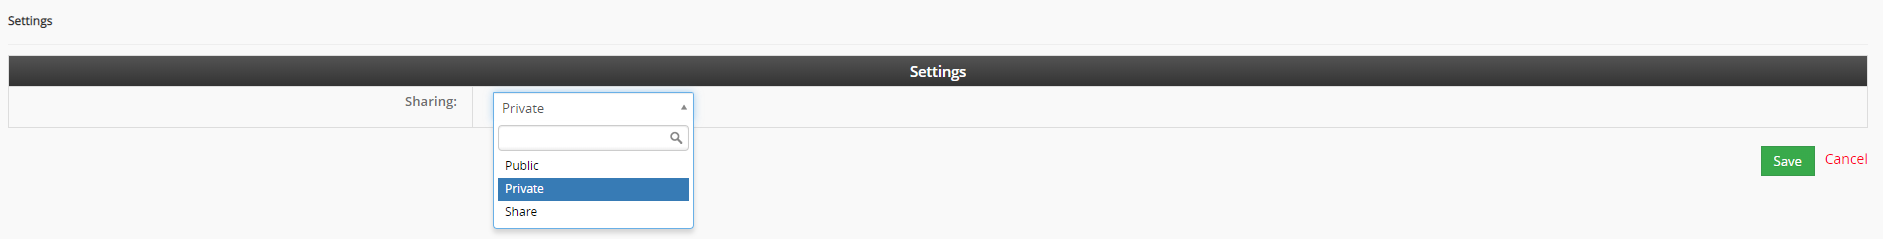
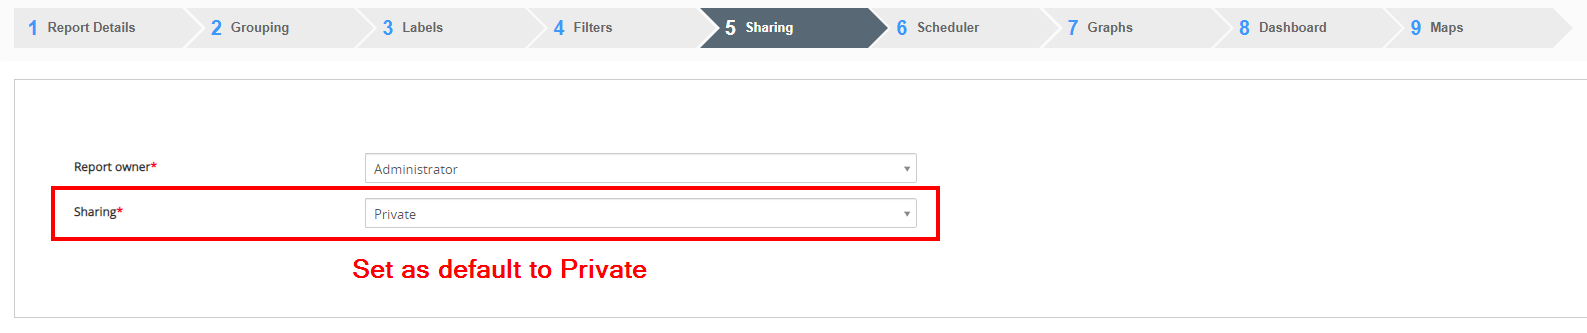
For example, if you set it as “Private” and then save it, all reports you create will be automatically set as “Private” in the Sharing step when creating reports, see below:
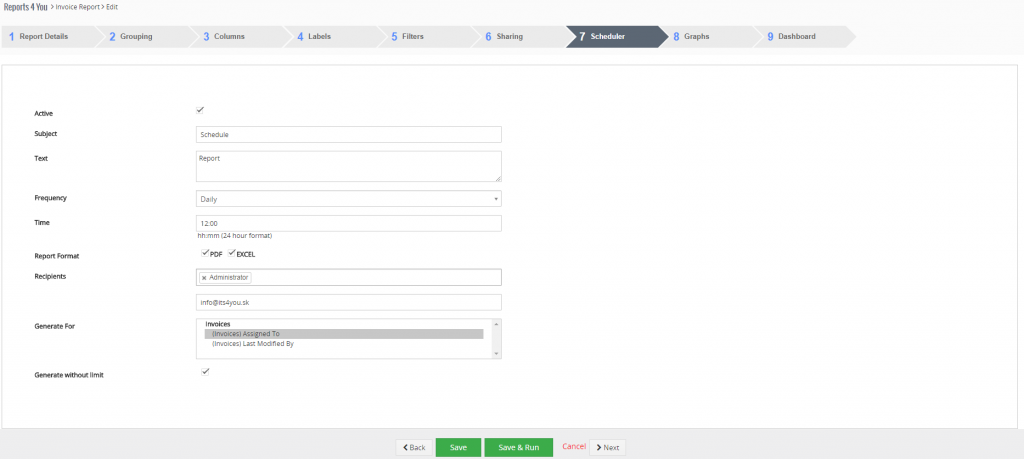
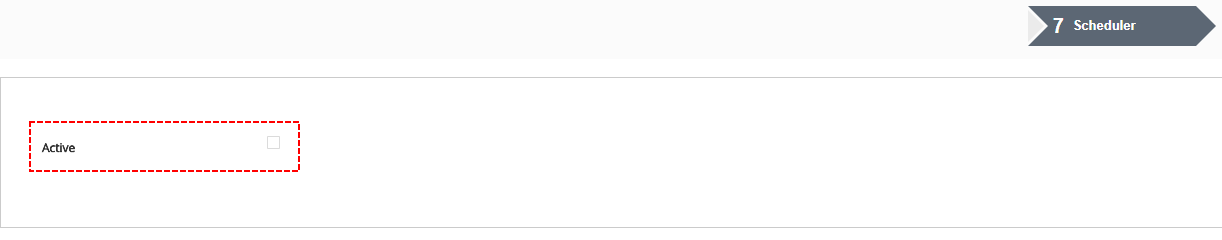
5.3.10.Scheduler
In this step, you can Send Reports at regular intervals to specific users through email without logging in to the CRM.
By default is Scheduler inactive. Do not forget to check “Active” to run this report using workflow scheduler.
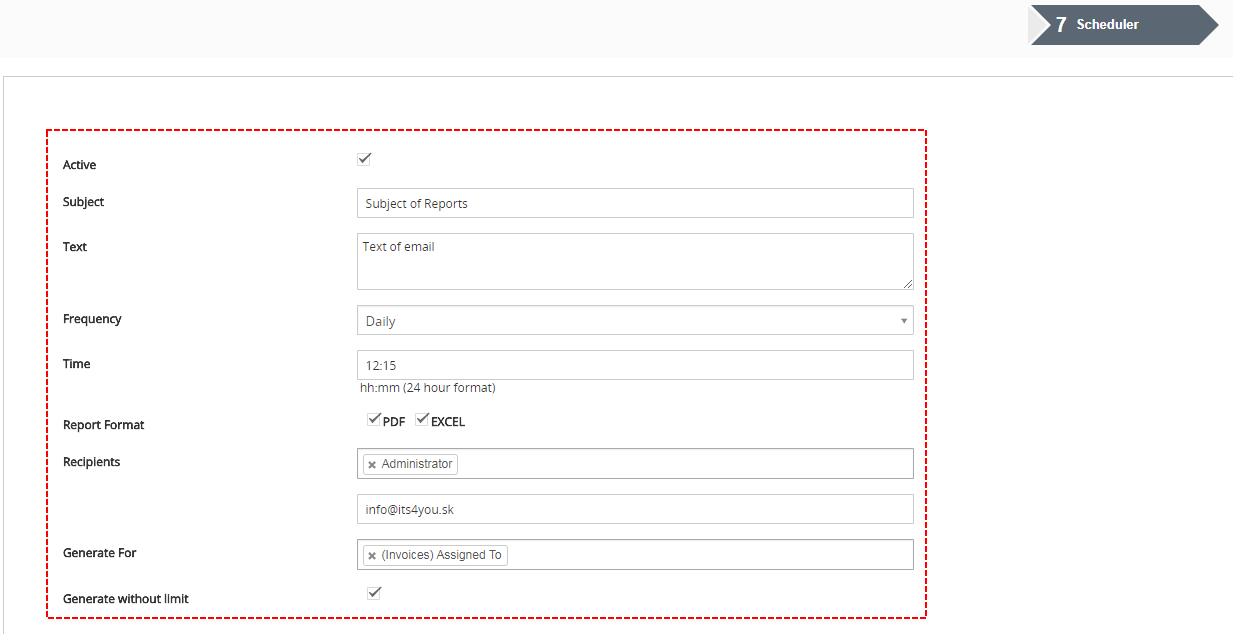
| Name | Description |
|---|---|
| Subject | Subject of Scheduled Email (Auto-generated if empty) |
| Text | Text (Body) of Email |
| Frequency | Frequency of Email sending |
| Time | Time of sending Email |
| Report Format | Format of included File |
| Recipients | You can choose Recipients (Users, Groups, Roles, Roles and Subordinates) |
| Other Emails | Here you can add other mail to CC. |
| Generate For | Based on Generate For Reports 4 You makes and sends Emails to Users based on their own privileges. |
| Generate without Limit | You receive Report without Limit set in Grouping part. In your CRM, Limit is still applied only in Email you will see Report without Limit. |
Differences between Recipients/Other Emails and Generate For
When you choose Recipients/Other Emails, all Users receive the same Reports like Reports Owner based on his privileges (e.g. 1 Report to 20 Users).
If you choose Generate For, then Reports 4 You send for each User particular Report based on User Field you choose (e.g. 20 Reports to 20 Users).

When you turn on Scheduler for some Reports, in ListView of Report 4 You you can see ![]() at this Reports.
at this Reports.
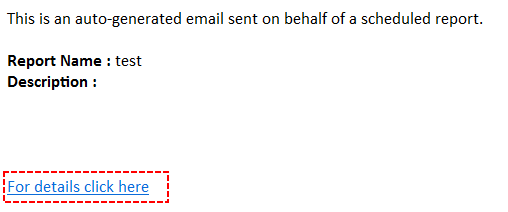
There is also Link to Report Detail included in received email.
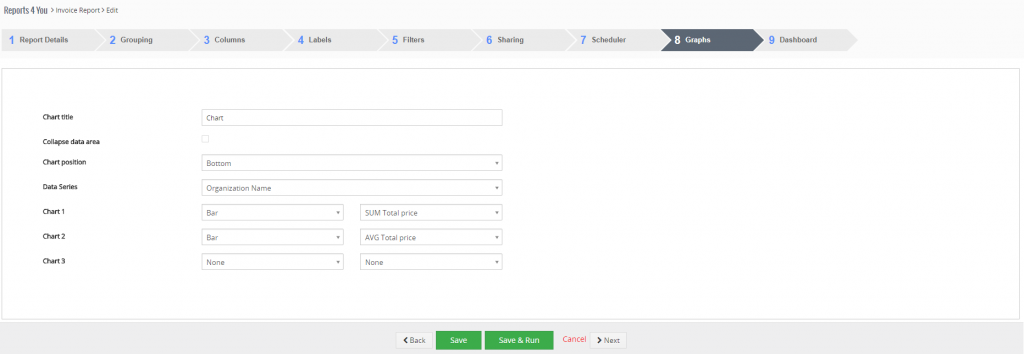
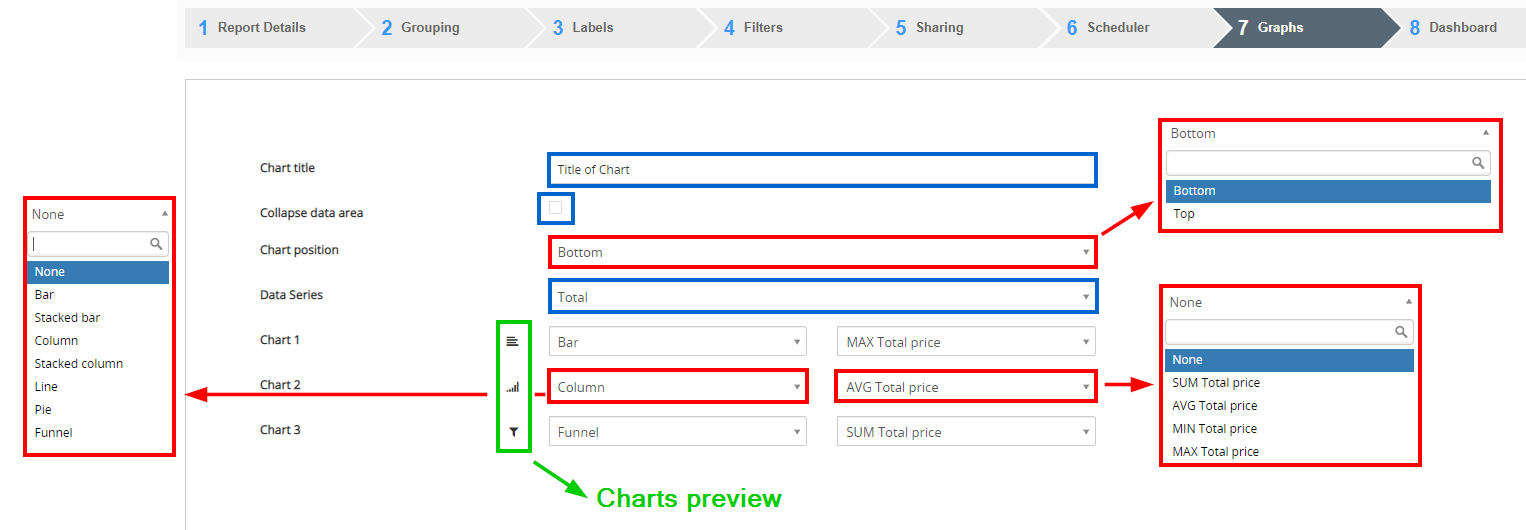
5.3.11.Graphs
Here, you can define Charts for every Report that is having a “Group by” definition and “Summaries columns”. Data series is using Summaries column values so you can define which one you want to use in charts.
Additionally, you can define Chart title, which is used in output files. Set Collapse data area or not and set Chart position. You are able to create up to 3 Charts. Here you can choose the chart type and Data Series.
Near each Chart type you see also icon as a preview how the chart will look like.
5.3.12.Dashboard
In Summaries Reports, Summaries Reports with Details and Matrix Report if you have Graphs you can use our useful functionality: Dashboards. Dashboards function allow add Widget to Dashboard of some modules and use also Primary search column to filter Graph direct from Dashboard.
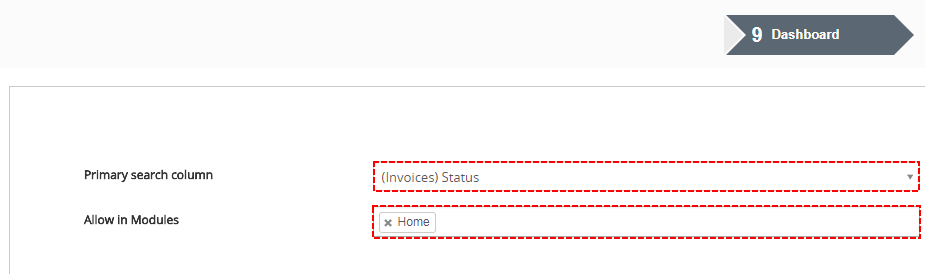
More about Dashboard you can find: Dashboard
6.Additional features
6.1.Data export
Within the Reports extension, it is possible to export report data into the Excel or PDF formats or even Print it.
Report buttons have two options when clicked on:
Report Data
Exports the generated report data using the limit in the Report.
All (tabular reports)
Exports data according to report settings without limit (i.e. all records)
In the background
It exports data according to the report settings without limit by CronJob/Scheduler and sends it to the user who performed the action.
6.1.1.Support of PDF Maker
With Reports 4 You you are able to save your Reports as PDF files. To save Reports as PDF you need to have PDF Maker (Free version sufficient).
PDF Maker is extension tool designed by ITS4You for vTiger CRM.
For more info about PDF Maker please read: www.it-solutions4you.com/pdf-maker
6.1.2.Support of Excel Export
With Reports 4 You you can also save your Reports as Excel files. To save click on button.
6.1.2.1.Currency column Disable/Enable
Some users prefer to not show this column in .xls exported files.
So here we will show you how to hide it:
- Go to vtigerfolder/modules/ITS4YouReports/configs/env/
- Create file with name XlsCurrencyColumn
– should be like : modules/ITS4YouReports/configs/env/XlsCurrencyColumn - Open the file and write in the value 0
– write it just as 0 without anything else
0 – currency column not shown
1 – currency column shown
Now the Currency column will be not showm in the exported .xls files.
6.1.3.AVG Calculation without empty values
Users which want an Average calculations without empty values or zero values can use this quick tip from us.
- Go to vtigerfolder/modules/ITS4YouReports/configs/env/
- Create file with name UseEmptyRowsCount
– should be like : modules/ITS4YouReports/configs/env/UseEmptyRowsCount - Open the file and write in the value 0
– write it just as 0 without anything else
0 -counts the AVG value with COUNT rows where the value is not empty
1 – counts the AVG value with COUNT rows where the value is empty
This configuration affects tabular report calculations.
Summaries report calculations are calculated by MySQL queries and user can simply filter off empty values there.
6.2.Support of Multi Company
With Reports 4 You you are able to generate your Reports across your Companies created by Multi Company extension.

Multi Company is extension tool designed by ITS4You for vTiger CRM which allows you in easier way to manage your companies within one vtiger CRM installation..
For more info about Multi Company please read: www.it-solutions4you.com/multicompany-extension-vtiger-crm
How to create Report based on Companies created by Multi Company you can find in our Tips & tricks
6.3.Key Metrics
The useful functionality of Reports 4 You is Key Metrics. Key Metrics allows you create Views on Dashboard(s) with information like Count of records based on Filter.
Extended version of Key Metrics included in Reports 4 You allows, after creating Tabular Report, use these Metrics ( SUM, AVG, Min, Max ) on Dashboard(s).

6.3.1.How to create and add Key Metrics on Dashboard?
To create Key Metrics please provide following steps:
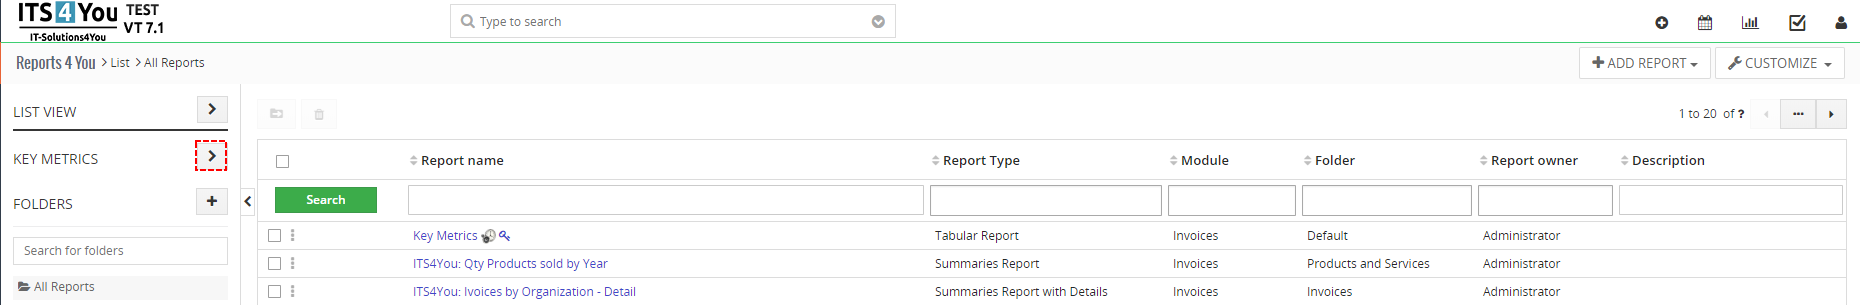
- Open Reports 4 You and click on

Key Metrics – Reports 4 You Vtiger 7 - Now, you can see list of your Key Metrics.
- To edit or delete Widget click on

- To add Key Metrics Row to show on Widget please click on Name of Widget
- to add new Widget click on
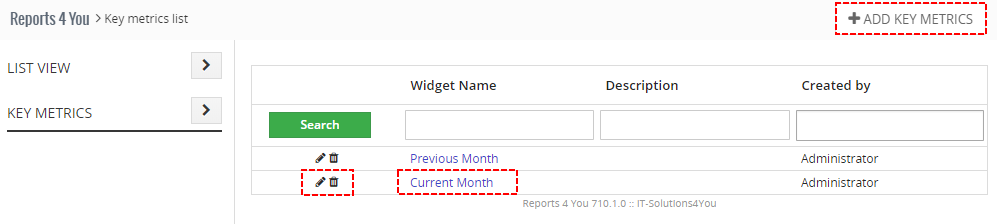
Key Metrics ListView – Reports 4 You Vtiger 7 - To edit or delete Widget click on
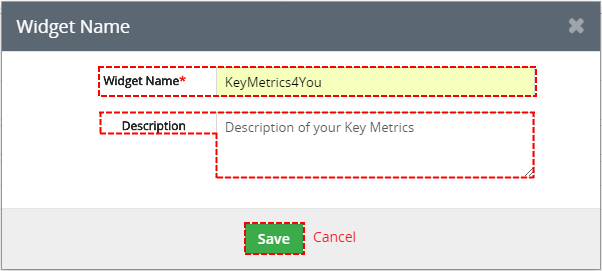
- Click on insert Widget name and also you can insert Description and save it.
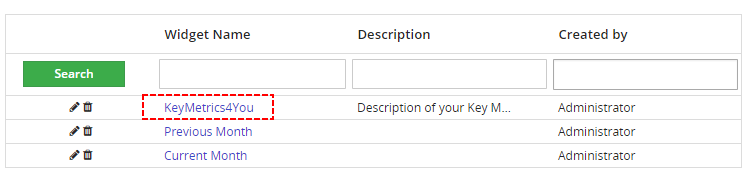
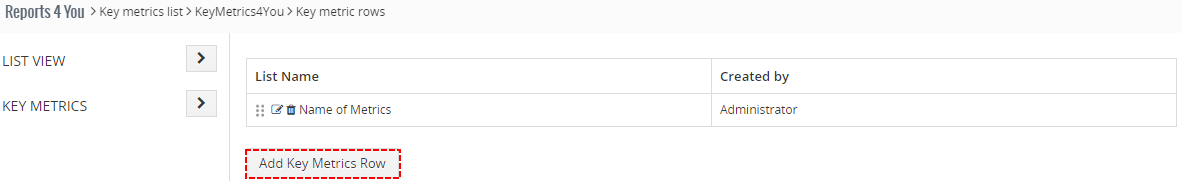
Add Key Metrics – Reports 4 You Vtiger 7 - Next step, is adding Key Metrics Row to calculate. Please click on Name of Your Widget
Add Key Metrics Row – Reports 4 You Vtiger 7 - Click on
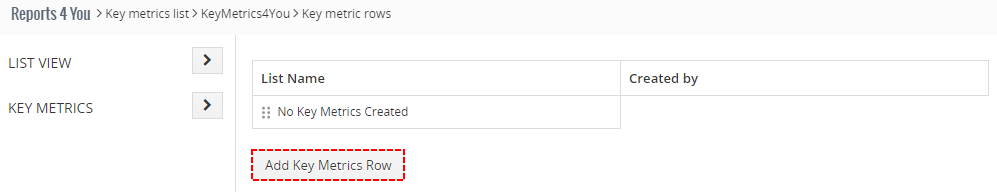
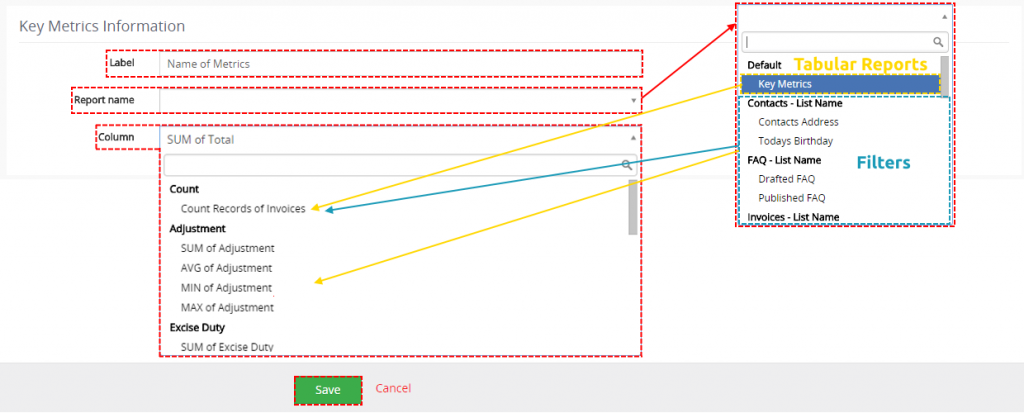
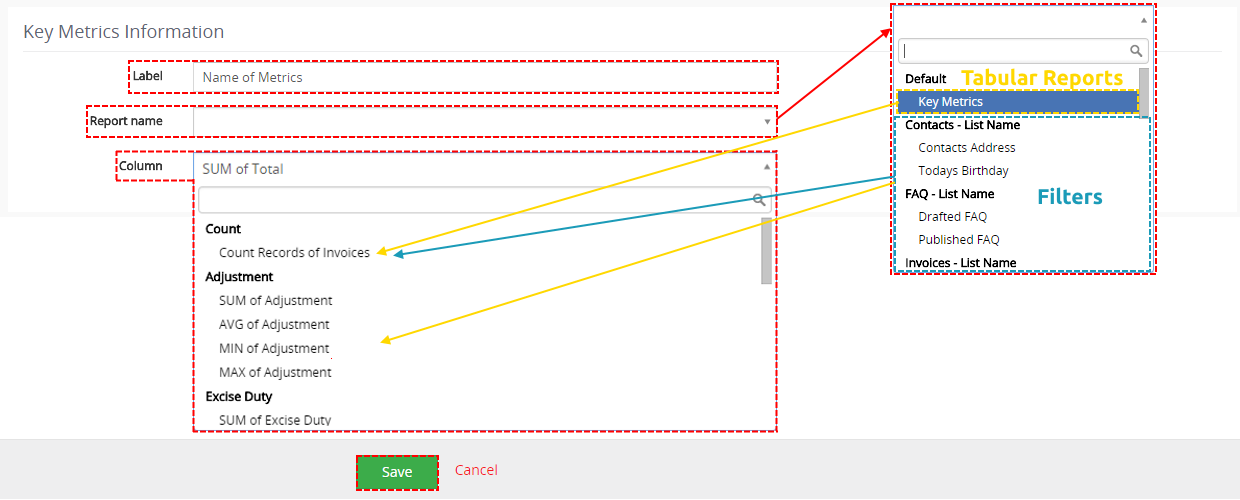
Add Key Metrics Row – Reports 4 You Vtiger 7 - Insert
- Label – Name
- Report Name – you can choose filter or tabular Report
- Column – if you choose only filter then you can select only Count of Records. If you choose tabular Report then you can select SUM, AVG, Min, Max from this Report
and save it.
Add Key Metrics Row – Reports 4 You Vtiger 7 - Now, you can repeat step 6 like you need.

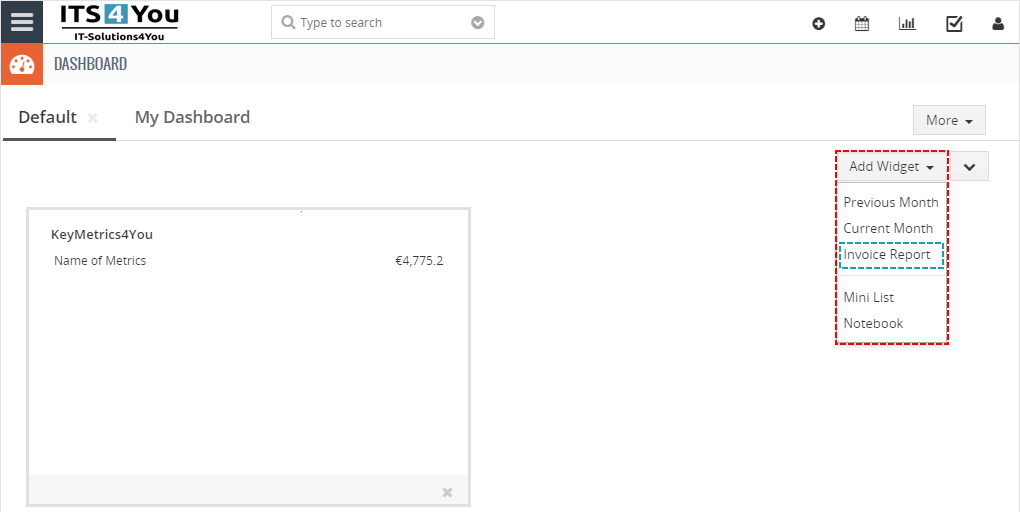
Add Key Metrics Row – Reports 4 You Vtiger 7 - To add Widget on Dashboard visit Home Dashboard, click on
 and find Name of Your Key Metrics.
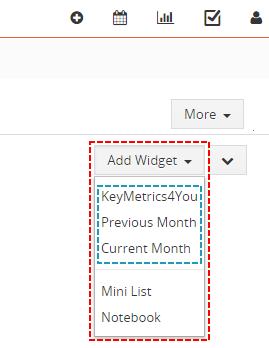
Add Key Metrics on Dashboard – Reports 4 You Vtiger 7
note
6.4.Dashboard
How to add Widget on Dashboard?
- Open your Dashboard, click on button and find your Name of Report
Add Widget on Dashboard – Reports 4 You Vtiger 7 - Now, you can see your Widget on Dashboard.

Add Widget on Dashboard – Reports 4 You Vtiger 7
![]() Notice for Vtiger 6.x users: Since the version of Reports 4.3 there was fixed a bug, where you were not able to increase the size of Reports 4 You Widgets in Vtiger 6. x, because it has got no option to resize it by default itself.
Notice for Vtiger 6.x users: Since the version of Reports 4.3 there was fixed a bug, where you were not able to increase the size of Reports 4 You Widgets in Vtiger 6. x, because it has got no option to resize it by default itself.
So if you are facing this issue, please update your Reports to the latest version via Installer.
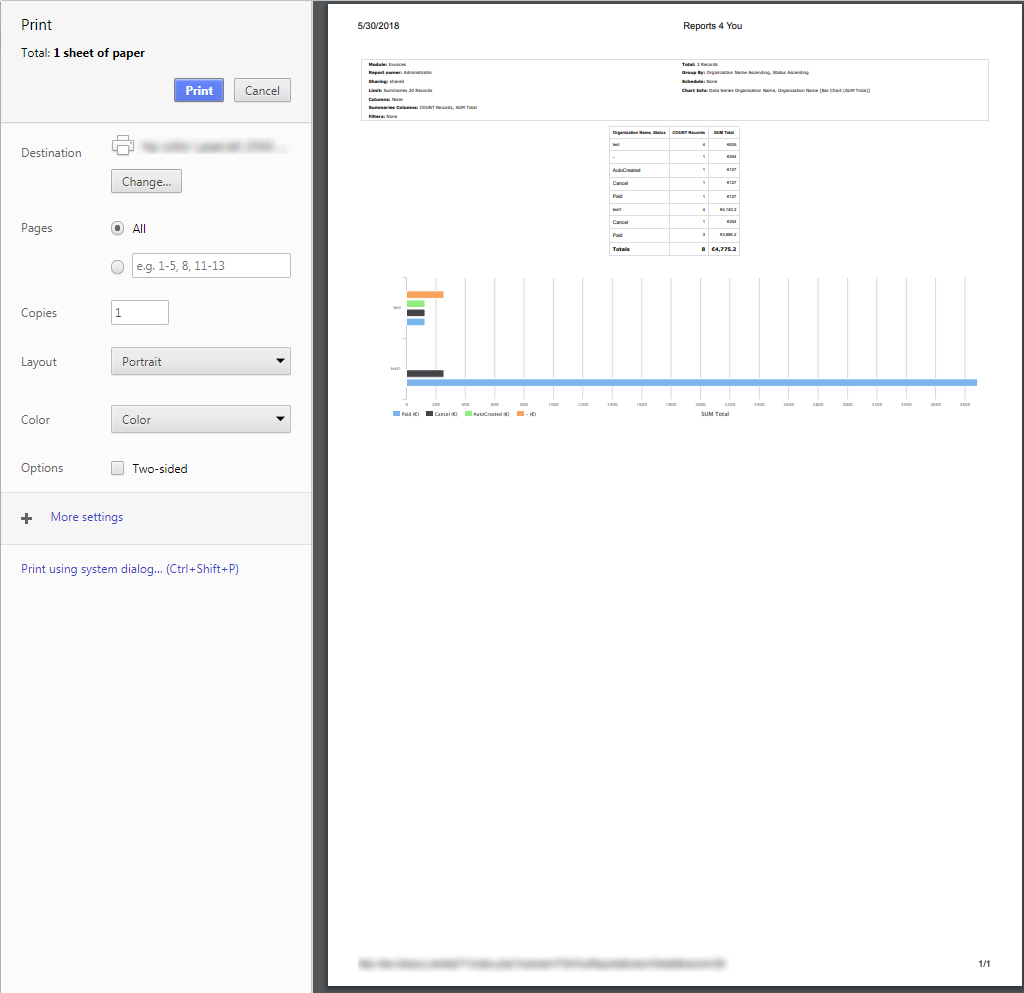
6.5.Print
There is also option to print your Reports directly from Vtiger CRM as well as print end export Charts. Click on
6.6.Bing Maps
With the version of reports ITS4YouReports_2_8_0 and higher. You are able to use Bing maps with our reports!
- To start using Bing maps you need to create API Key. You can do that by going into Reports module, then click on the button and select “API Key Settings”.
- You must create key for Default usage or users can have their own key. How to get the Bing Map Key simply click on this URL text, see image below:

- You will be redirected to the guide how to get a Bing Maps Key. Obtain key and choose if you want it for Default or User defined and paste the key in the window. Then “Save”.
After you successfully created and applied Bing Map Key, you can proceed to create or edit your reports. When you are creating report you have a step called “Maps” see image below:
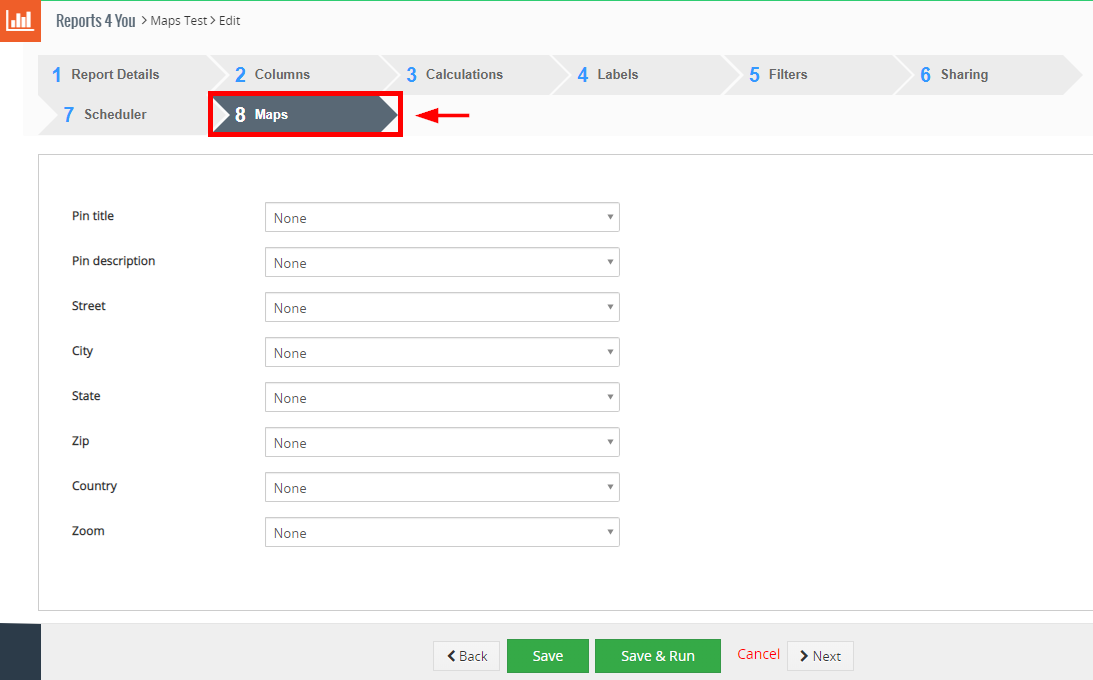
You will have to select mapping for the fields in this step, explanation of the fields is below:
- Pin title – title for the pin which will be shown on the map, select any value from the pick list
- Pin description – select field which will be used as description
- Street – select street field, for example Billing Street
- City – select city field, for example Billing City
- State – select state field, for example Billing State
- Zip – select postal code/zip field, for example Billing Postal Code
- Country – select country field, for example Billing Country
- Zoom – how much zoomed your map will be (optimal is 7)
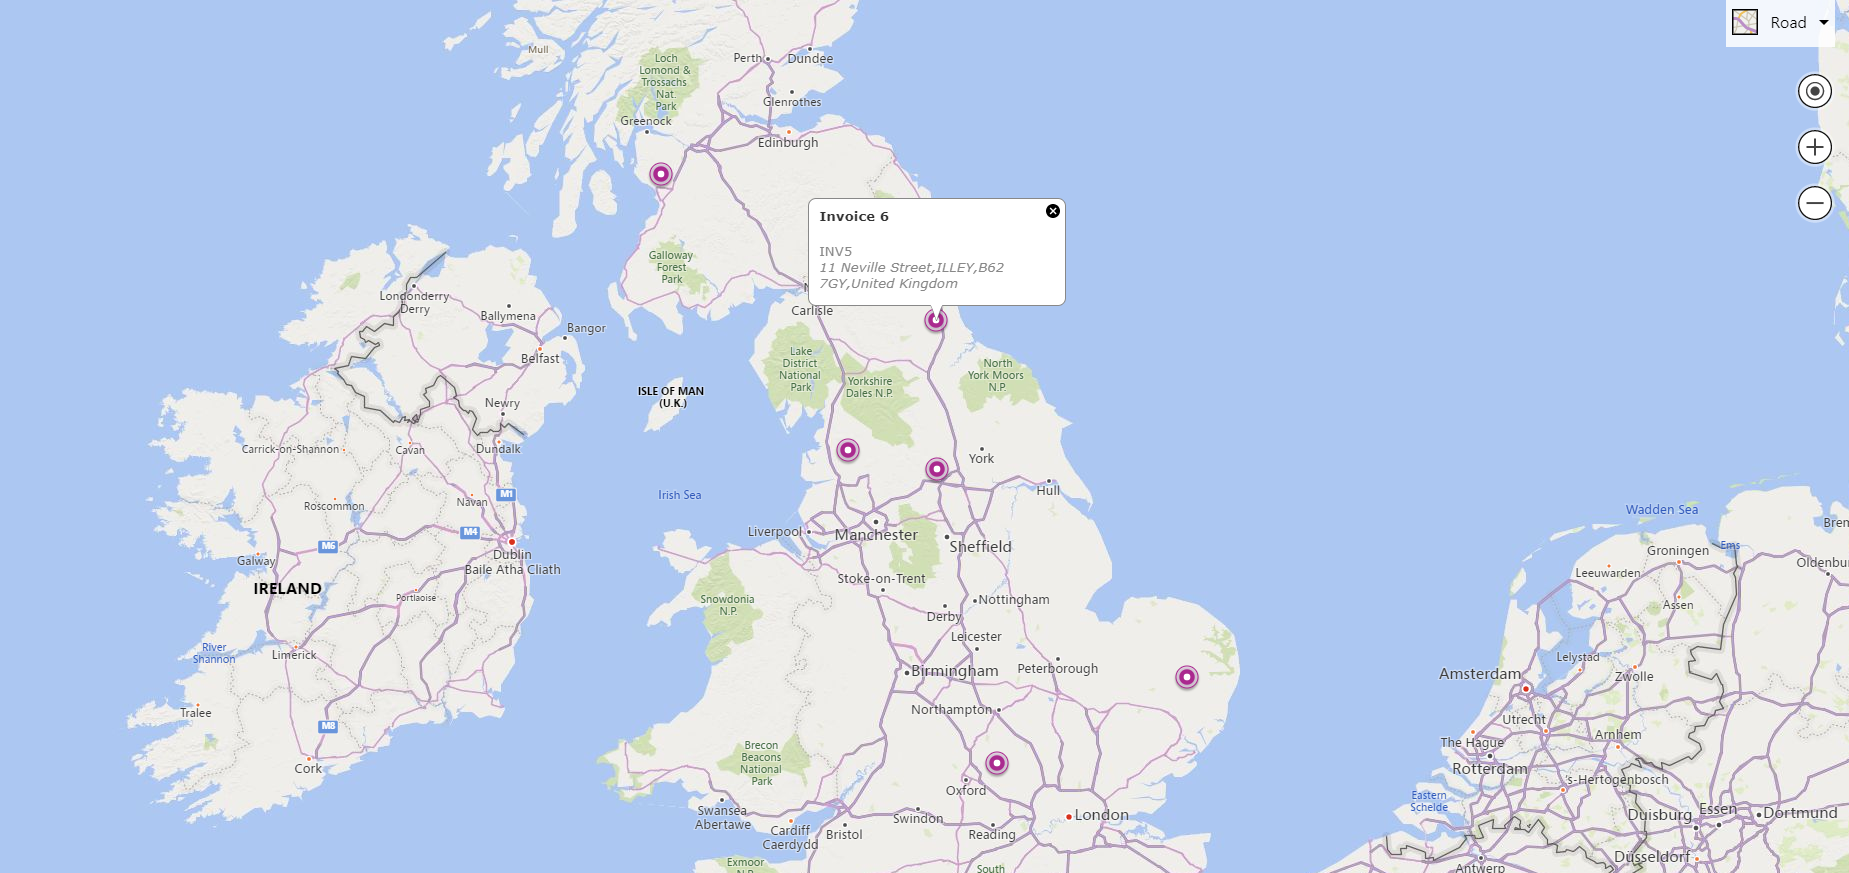
When you are done with “Maps” step, proceed with generating reports. In the detail view of the report, please click on the “Display Map” button like it’s shown on the image below:

The result is that our Invoices are shown on the map based on the Billing details used:
7.Settings
The Reports 4 You settings are accessible directly from the ListView and consist of:
- License settings – manage all settings related to your license
- Uninstall Reports 4 You – remove Reports 4 You completely from your Vtiger
- Upgrade Reports 4 You – upgrade/update Reports 4 You
7.1.License settings
Since December 2019/January 2020 all our modules will be using Installer to manage licenses. Please check our Installer pages for more information.
You can access the License settings like its shown below:
(there can be more options from the pick-list, depends on the module)
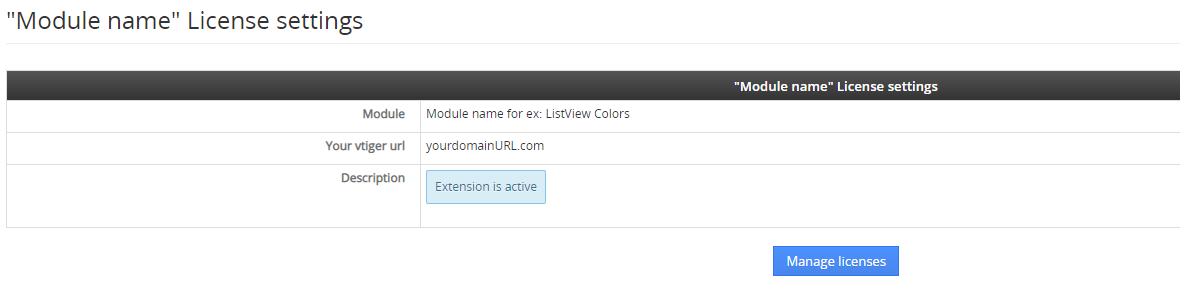
After accessing the License window you can see screen bellow with following information:
- Module name, Your Vtiger domain URL
- Description, if license is activate or not:
 – your license is currently active,
 – your license is not active and you need active it via Installer.
To activate or manage license, click on the ![]() button.
button.
7.1.1.Deactivate license
If you want to deactivate your license, please provide following steps:
- Go to your Installer, by a click on Notifications Icon and then on the button ,
or via Main Menu – Settings – CRM Settings – Extensions – ITS4YouInstaller - The following screen will appear (see below):
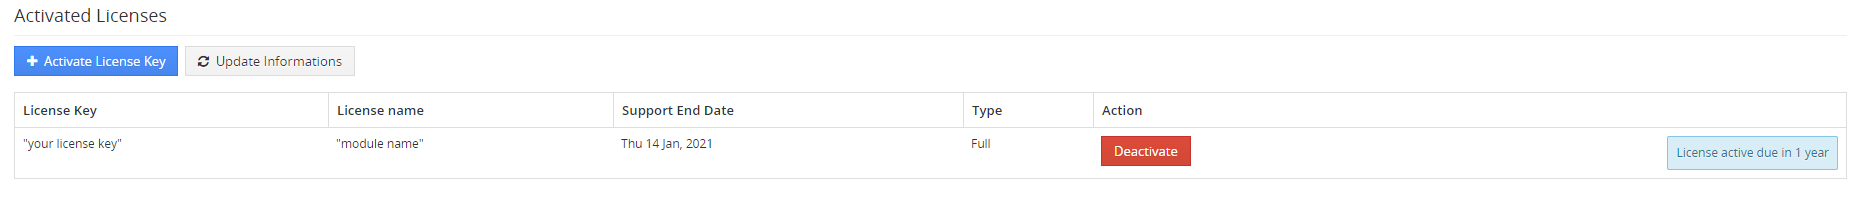
Installer – deactivation of license You can deactivate license by click on the button

![]() Note: The module will be deactivated but not uninstalled and license will be removed from the Activated Licenses tab.
Note: The module will be deactivated but not uninstalled and license will be removed from the Activated Licenses tab.
7.1.2.Reactivate license
To reactivate a license after deactivation, you need to follow the same process as you activated it first time:
- Click on the
 button and enter your license key.
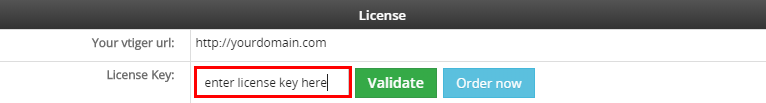
- Confirm with
 button.
When the license was activated you can see module available in the Modules tab below.
![]() Note: To see modules and manage licenses you have to log in to our e-shop with @email and password via
Note: To see modules and manage licenses you have to log in to our e-shop with @email and password via ![]() button (top right screen side in Installer module).
button (top right screen side in Installer module).
7.2.Update
The upgrade of the module is initiated manually or via our Installer.
Updating via Installer:
- open the Installer in the CRM
- in the Modules tab find your installed module and you should see the button available
- If the new version is available, you will be notified via Installer Notifications icon
Updating Reports manually:
So please refer to above installation part for details how to initiate the import of the module from the file. As can be seen on following picture you will be notified that the Reports 4 You module already exists. The upgrade will start immediately when you click on the button.
After upgrade the notification about successful upgrade is shown.
7.3.Uninstall
If you need to remove the module from your Vtiger you have two options:
- Uninstall via Installer.
- Manually via going to module Settings and choose Uninstall option.
7.3.1.Uninstall via Installer
You have also option to remove the module via Installer window by accessing the Settings – Uninstall window:
- Go to your Installer, by a click on Notifications Icon and then on the button ,
or via Main Menu – Settings – CRM Settings – Extensions – ITS4YouInstaller - Find the module you need to uninstall in the Modules tab
- Via
 pick list button choose the Uninstall option, you will be redirected to the Uninstall window.
 - Click on
 button
- Confirm uninstall with
 button
Now, the module has been removed from your Vtiger and your license has been deactivated. To use this module again, you need to provide installation and validation steps (see Installation chapter).
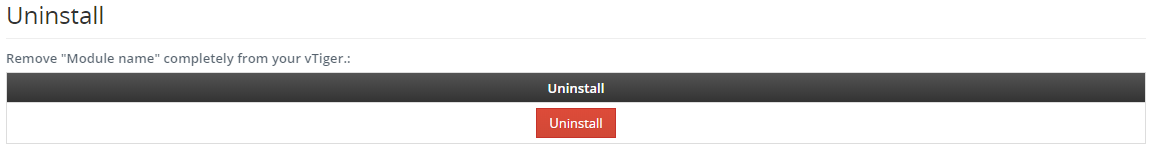
7.3.2.Manual Uninstall
There is also available option to remove Reports 4 You from your Vtiger manually. To uninstall please provide following steps:
- Go to the list view of Reports 4 You and in Customize choose option Uninstall Reports 4 You
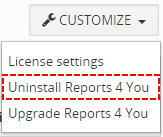
Uninstall – Reports 4 You Vtiger 7
- Click on
 button
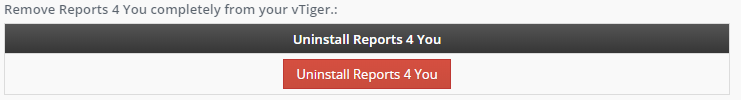
Uninstall – Reports 4 You Vtiger 7
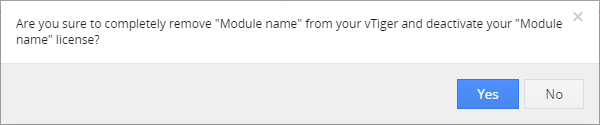
- Confirm uninstall with
 button
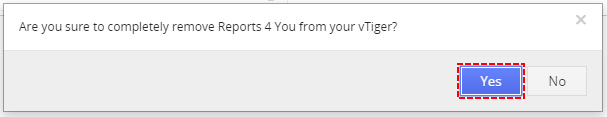
Uninstall – Reports 4 You Vtiger 7
Now, Reports 4 You has been removed from your Vtiger and your license has been deactivated. To use Reports 4 You again you need to provide installation and validation steps (see chapter 2. How to install Reports 4 You).
8.Tips & tricks
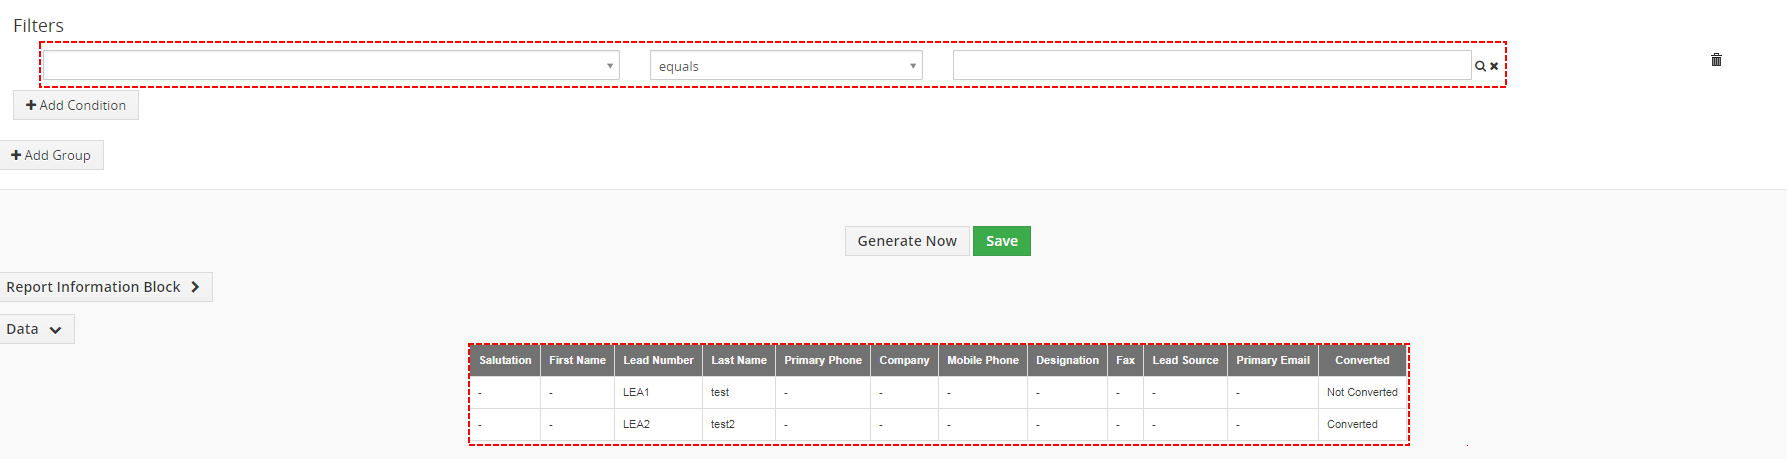
8.1.Show converted Leads
As you may know, converted Leads are no more shown in your Vtiger CRM. But for lot of customer it is important to see these Leads. With Reports 4 You you have option to show these Leads or no. It is really up to you. Since 7.1.1lead version is default filter for Leads module “Converted [None] Yes”:
 .
.
Now, you have 3 options of making your Report:
- Report of not converted Leads – instead of “None” please use condition: not equal to
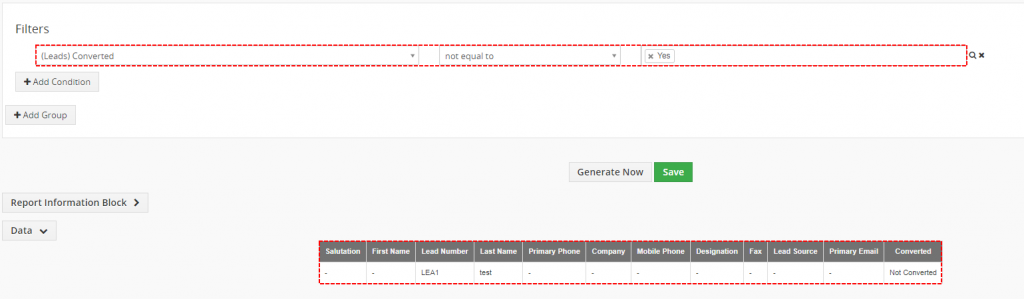
Report of not converted Leads – Reports 4 You Vtiger 7 - Report of converted Leads – instead “None” please use condition: equals
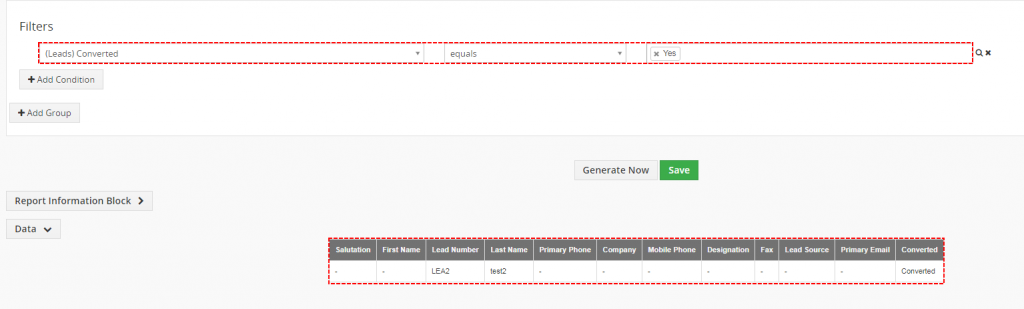
Report of converted Leads – Reports 4 You Vtiger 7 - Report of all Leads – remove please this filter
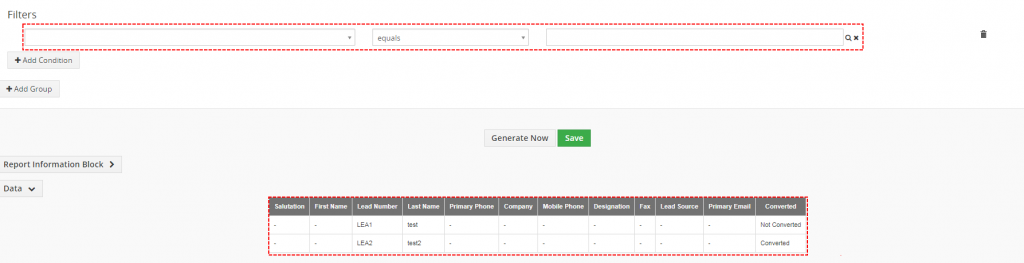
Report of all Leads – Reports 4 You Vtiger 7


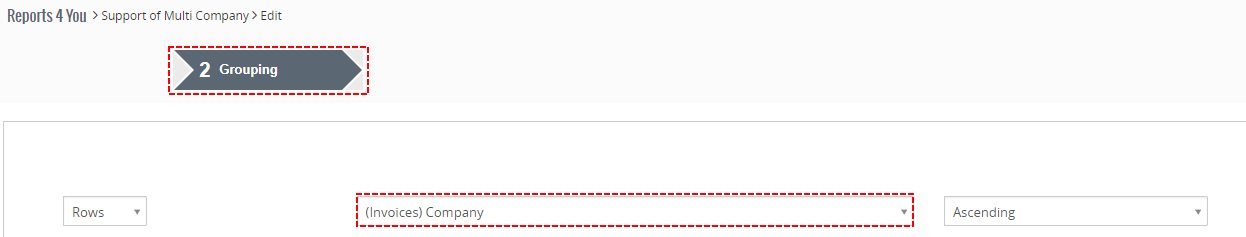
8.2.Report based on Multi Company
There should be also question how can CEO see Reports across all Companies created by Multi Company created by IT-Solutions4You?
This option should be possible for Summaries Report, Summaries with details and Matrix Report.
You just need to use grouping by field Company.
9.Known Issues
Add more Key Metrics on Dashboard at the same time
If you have more Key Metrics and you want to add all Key Metrics on Dashboard at the same time.
If you add first Key Metrics on Dashboard then other Key Metrics are not visible under button?
Yes, it is little issue with loading content. To display rest of your Key Metrics just please refresh your page.
10.Change log
- Check latest versions available and fixes applied
- What was changed/added to manual
10.1.Reports 4 You
- 26 March 2024: 4.38
- fixed export to .xls where empty cells didn’t equally generated reports data
- fixed some sub query generation bugs
- 31 January 2024: 4.37
- fixed export to .xls where empty cells didn’t equally generated reports data
- fixed issue where changed labels were not working after generating a report
- 10 January 2024: 4.36
- added Dashboard HTML widget for Vtiger 6x
- uitype 53 query generation fixed
- Matrix report wrong column cells when export to .xls has been resolved
— 2023 —
- 19 October 2023: 4.34-35
- fixed Report detail – where Save button didn’t appear after filter modification
- fixed Matrix Report – Export to XLS where some columns were missing
- other minor fixes for PHP 8 version
- 4 April 2023: 4.33
- fixed Totals count population
- fixed Save records session unset
- fixed exports and generations
- removed Inactive users from the saved recipients list on Scheduling
- 27 February 2023: 4.32
- Vtiger 7.5 and PHP 8.x compatibility
- 16 February 2023: 4.31
- removed “??” from GenerateObj to support older PHP versions
- fixed Tabular Total calculations
- fixed missing Total Calculations in PDF Export
- fixed users entries pagination
— 2022 —
- 5 October 2022: 4.30
- added “contains” condition for Multi picklist fields
- fixed issue where Scheduling didn’t send all records in the .xls export file
- fixed Matrix reports which were missing grouping totals values
- 6 September 2022: 4.29
- CSV headers are displayed in one column cell – fixed wrong separator
- CSV separator input missing in scheduler tab – fixed
- Log Work Start date interval group range missing in summary Reports
- fixed Javascript filter bugs
- fixed limit and calculations of scheduled recording
- fixed range filters in case of the big time zone (Thanks Ruben for simulations)
- enhancement common_debug, detail_debug parameters for SQL analyze
- minor XLS export bugs fixes
- 27 July 2022: 4.28
- results pagination for tabular reports
- new export options
- Report data (reported data with limit)
- All data (reported data without limit)
- In the background (all data by cronjob)
- Alan Lord – use empty rows count
- created time query filter conditions updated by timezones – start time / end time
- 13 May 2022: 4.27
- added new Pie percentage chart type
- improved multi-select box search, translation
- xls export will show the correct currency column value
- fixed issue where xls AVG calculation was wrong in the case of results with empty rows
- fix list view search by submit search bars
- removed prefix “ITS4You” from the default names of the reports
(applied only when installing extension)
- 10 February 2022: 4.26
- Bing maps will now show address properly and will no longer show any errors
- Custom view access in Key Metrics has been fixed
- selected fields will no longer cause issue when using a FR language
- existing reports will be no longer removed from Dashboard when edited
- Description fields will be now properly generated and no longer case issues like happened in some rare cases
- improvement condition does not contain now display also null entries
- Vtiger 6.x shared report with users does not display issue has been resolved
- 12 January 2022: 4.25
- added new filter date conditions: After and Before specific date
- added possibility of average value in summary graphs
- monthly scheduling will now work properly
- other minor bug fixes and improvements
— 2021 —
- 17 August 2021: 4.24
- add Report widget on the Dashboard will be shown now properly based on permissions for the current report
- custom totals calculations will no longer cause issues related to messed up or empty results
- filter for Custom Date will now properly work when using “.” as separator between days/months/years
- 10 August 2021: 4.23
- Vtiger 7.4 compatibility
- 21 July 2021: 4.22
- summary details now should correctly show records which can be clickable (record will open in CRM)
- fixed saving or editing reports which caused the error: “Error while inserting the record (QUERYID).”
- fixe translation of chart data series for stages
- 15 July 2021: 4.21
- added quick hotfix for the problem where calculation SUM was not working and AVG and MAX values were multiplied
- 7 July 2021: 4.20
- custom date wrong formatting issue was resolved
- bing maps will now show title correctly
- number of decimals for custom calculations were fixed
- an issue where was not possible forward or back in scheduler step was resolved
- fixed query issues while generating reports
- custom calculations should now calculate values correctly
- in some rare cases the installation of extension caused errors, this has been resolved
- 17 June 2021: 4.19
- the problem where it was not possible to go backwards or forwards from the scheduler step was fixed
- fixed query generation of reports, which in some rare cases caused an error upon error generation
- 09 June 2021: 4.18
- improved .csv export / sending
- fixed issue where reports were not presented on the dashboard based on report settings
- fixed interval issue for Filter values “last month” and “next month”
- fixed issue with wrongly displayed calculations in totals table
- other minor bugs have been fixed
- 29 April 2021: 4.17 (4.16 was skipped)
- added .csv format files for Scheduled reports
- added ability to define .csv export path after schedule
(using UTF-8 encoding for .csv clients is recommended)
- 19 April 2021: 4.15
- reports generation enhancements: relation fields, user fields
- inventory results generation speed increased
- reports which are using filter “Reports to” should now be generated properly
- deleting reports will now properly remove reports on the dashboard too
- fixed issue where charts were missing from exported PDF
- fixed issue where non admin users were not able to see reports (blank page or error was presented)
- minor bug fixes
- 03 March 2021: 4.14
- fixed query generation issues
- 18 February 2021: 4.13
- One of our biggest extensions Reports 4 You has been enhanced by an installation process that has caused some users a problem installing highcarts due to bad folder permissions.We added a notification when installing highcharts, so users can see where is the problem.
Here is a notification you get while installing highcharts and write permissions has to be corrected: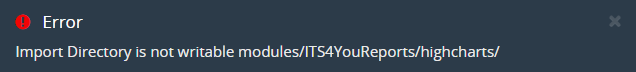 To fix this problem set the following permissions for folder highcharts:
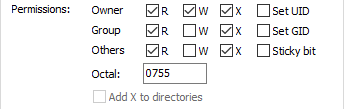 Some other improvements and fixes were added:
 - export of reports to PDF and XLS no longer causing messed up layout in exporting files
- modComments query generation will no longer fail
- other minor bug fixes which will improve reporting
- One of our biggest extensions Reports 4 You has been enhanced by an installation process that has caused some users a problem installing highcarts due to bad folder permissions.We added a notification when installing highcharts, so users can see where is the problem.
- 27 January 2021: 4.12
- added new feature Scroll bars for reports on Dashboard
- improved installation of HighCharts by adding and buttons instead of manually copying higcharts to your FTP Reports folder
Reports 4 You – New instalaltion of HighCharts
- added option to select Product image field when creating reports (Product image name)
- improved speed and caching
- improved text area of displaying data
- fixed issue where feature Export to PDF caused messed layout of the .pdf file
- fixed issue where deleted folders were still visible in the list
- minor improvements
— 2020 —
- 18 November 2020: 4.11
- added new feature, tables for Dashboard for summaries and table reports
- improved installation for HighCharts feature, we made it more user friendly so you don’t need to copy files manually
(please make sure permissions for folders are correctly set) - fixed issue where custom calculations were missing in .xls exported files
- 16 October 2020: 4.10
- fixed issue where purchase cost was not loaded loading from Poducts and Inventory (only Inventory)
- fixed issue where scheduled reports did not send attached pdf files
- fixed issue where export to .xls was showing a blank page in summaries with details and summary reports
- 01 October 2020: 4.9
- fixed issue with Bing maps query request
- fixed Matrix Reports design
- Calendar data query permissions fixed
- Date Time fields now displaying in a correct format
- fixed multiple report info conditions / unique values for filter conditions
- the max records limit is now not displaying when less than totals
- fixed issue where scheduled reports were not working when enabling them again via edit
- fixed issue where scheduled reports were not sending XLS files when the only XLS option was enabled
- fixed issue in Vtiger 6.x where sender info was sometimes not correctly presented
- 26 August 2020: 4.8
- fixed issue where currency fields disappeared from report display columns
- 25 August 2020: 4.7
- added multiple dashboard loadings (Vtiger 7.x)
- added ability to use one chart in more dashboard tabs (Vtiger 7.x)
- added ability to use Purchase Cost and Margin in Reports extension
(these fields are hidden by default in Vtiger) - added ability to set conditions based on existing currencies
- charts now showing numbers with correct formatting
- fixed issues where emails were not send with some specific PHP settings
- minor bug fixes
- 14 June 2020: 4.6
- fixed issues where special characters of users were not correctly shown
- fixed issue with resizing widgets on dashboards
- fixed issue where Bing Maps were not working because of SSL certificated URLs
- fixed issue where users were not able to click on the menu from Bing Maps settings
- fixed issues with shared reports where they were not shown in the list view
- fixed problem with using daily, hourly scheduler
- fixed problem where custom reports were sometimes causing issues for Vtiger 6.x (missing sql tab)
- fixed problem where .xls reports had a broken content
- fixed issue where custom report sharing didn’t allowed to execute the report
- 03 April 2020: 4.5
- fixed issue for Vtiger 6.x with generating scheduled reports
- set correct icon for Line Chart options
- 01 April 2020: 4.3 – 4.4
- fixed issue where fields Created Time and Modified Time did not apply to the user time zone
- unitize PDF export info blocks for Online and Scheduling
- 31 March 2020: 4.2 – 4.3
- minor bug fixes
- unitize PDF generation for Page and Scheduling
- added list view setting link and option to set up default sharing. Default sharing is applied in Creation of Reports/Sharing tab
- increased size of Reports 4 You Widgets in Vtiger 6. x, because it has no option to resize it by default itself
- added small icon near the chart type selection to give hints to the user how does charts looks like
- added Tax class column for Products module
- 02 March 2020: 4.1
- fixed issues with query generation
- fixed issue where Italian reports did not work correctly
- fixed problem with columns while exporting Summaries with detail report to XLS – missing Currency Columns identification
- January 2020: 4.0
- new validation system via our FREE extension Installer
— 2019 —
- October 2019: 710.02.08.01
- minor bug fixes
- October 2019: 710.02.08
- improvements for the Bing maps
- fixed issues with Matrix reports
- fixed failed query of reports
- September 2019: 710.02.07
- added feature Export to Bing maps (Vtiger 6.x/7.x)
- fixed issues like: query generation, filters JS bug custom report V7 compatibility
- fixed issue where key metrics did not saved in dashboards
- July 2019: 710.02.06
- fixed validation
- fixed sharing permission selection for Vtiger 6 version
- June 2019: 710.02.05
- fixed validation
- Custom totals calculation enhancement
- April 2019: 710.02.03 – 710.02.04
- fixed issue with custom date filters, when filtering through the months, change steps did not work
- added custom calculation into totals for Tabular Reports
- April 2019: 710.02.02
- fixed issue with export XLS currency data with amount and currency in separated columns
- inventory totals and columns query problem fixed
- March 2019: 710.02.01
- new format used for versions
- PHP 7 compatibility
- minor fixes
- February 2019: 710.1.12
- minor fixes
- fixed issues with blank page when you used “Generate Now” button
— 2018 —
- December 2018: 710.1.11
- fixed issues with license validation
- November 2018: 710.1.10
- fixed issues like:
problem to create calendar Report in Greece language
Calendar tabular Report Sum duration was doubled
query generation failed when sorting by created time
related list report display deleted data
wrong summaries with detail headers
.xls file name when scheduling only xls files
display correct created time and filter in a right way
- fixed issues like:
- September 2018: 710.1.8 – 710.1.9
- fixed issue where you had a blank page when there was missing some blocks in the CRM system
- fixed issue with empty results after edit of Report with custom date condition
- data not displayed in user date format issue fixed
- August 2018: 710.1.7
- added Calendar summary of Duration for Tabular and Summaries Reports
- August 2018: 710.1.6
- fixed issue where calendar fields were missing when creating new Report
- June 2018: 710.1.5
- fixed issue where total calculations amount of tabular reports were doubled
- June 2018: 710.1.4
- minor fixes
- June 2018: 710.1.2
- minor fixes
- June 2018: 710.1.1
- first initiate version for Vtiger 7.x
10.2.Manual for Reports 4 You
- January 2020: manual based on Reports 4 You version: 4.0
- updated chapters: Installation, Updates, License settings, Uninstall
- new licensing via Installer – additional chapters added
- September 2019: manual based on Reports 4 You version: 710.02.07
- added Bing Maps and updated some chapters of the manual
- June 2018: manual based on Reports 4 You version: 710.1.1
- first initiate version for Vtiger 7.1.0