

6.1 Data export
Within the Reports extension, it is possible to export report data into the Excel or PDF formats or even Print it.
Report buttons have two options when clicked on:
Report Data
Exports the generated report data using the limit in the Report.
All(tabular reports)
Exports data according to report settings without limit (i.e. all records)
In the background
It exports data according to the report settings without limit by CronJob/Scheduler and sends it to the user who performed the action.
6.1.1 Support of PDF Maker
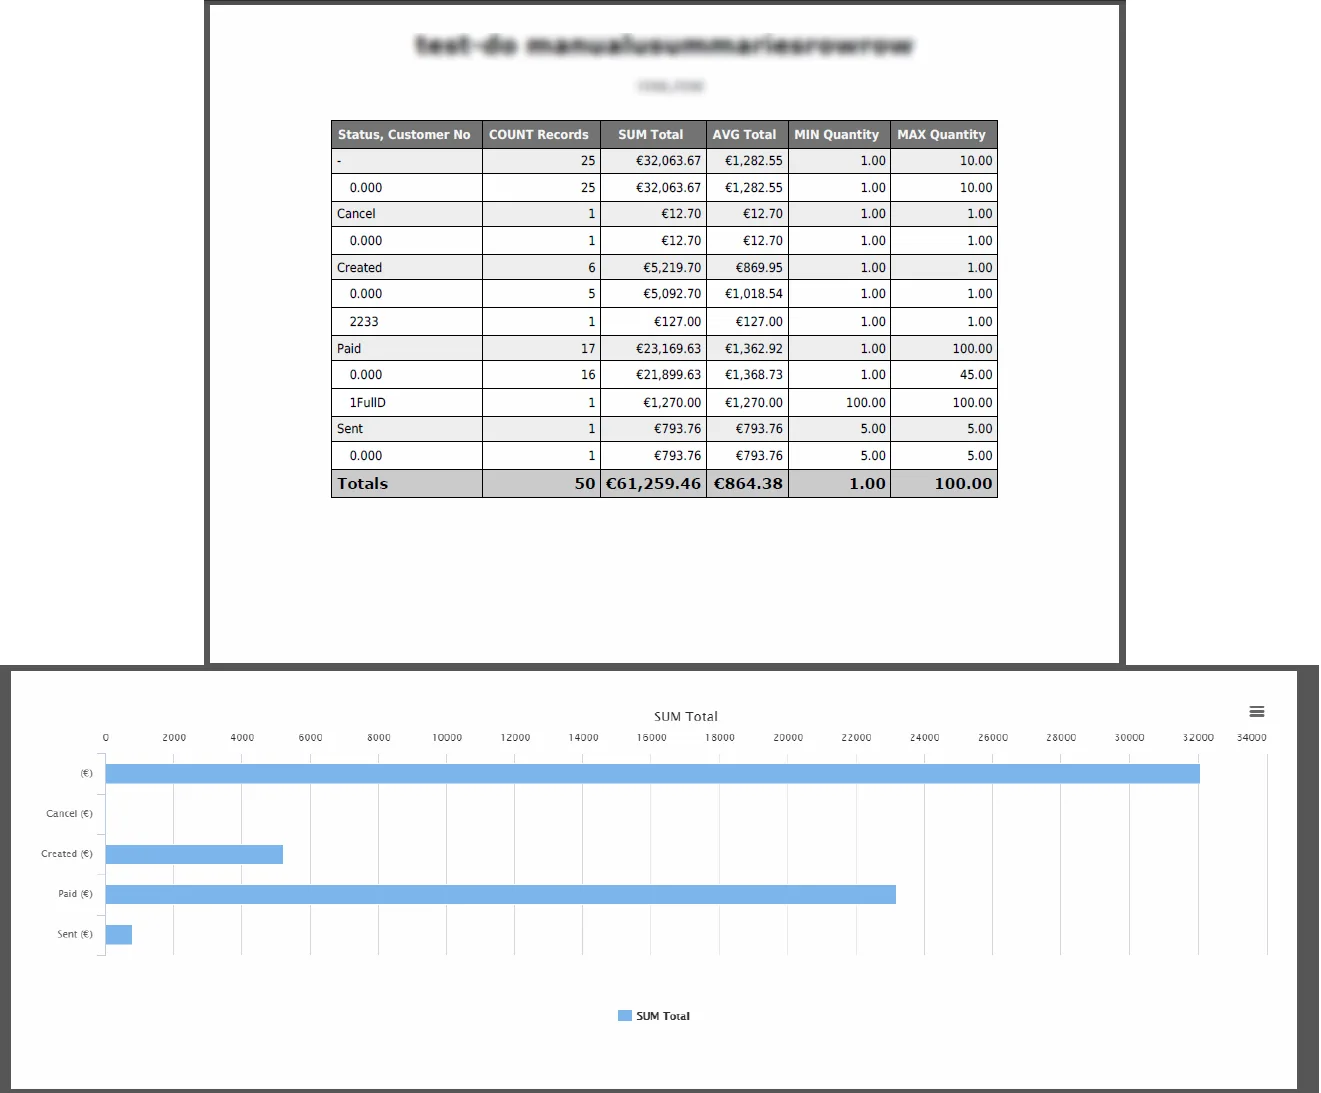
With Reports 4 You you are able to save your Reports as PDF files. To save Reports as PDF you need to have PDF Maker (Free version sufficient).
PDF Maker is extension tool designed by ITS4You for vTiger CRM.
For more info about PDF Maker please read: www.it-solutions4you.com/pdf-maker
6.1.2 Support of Excel Export
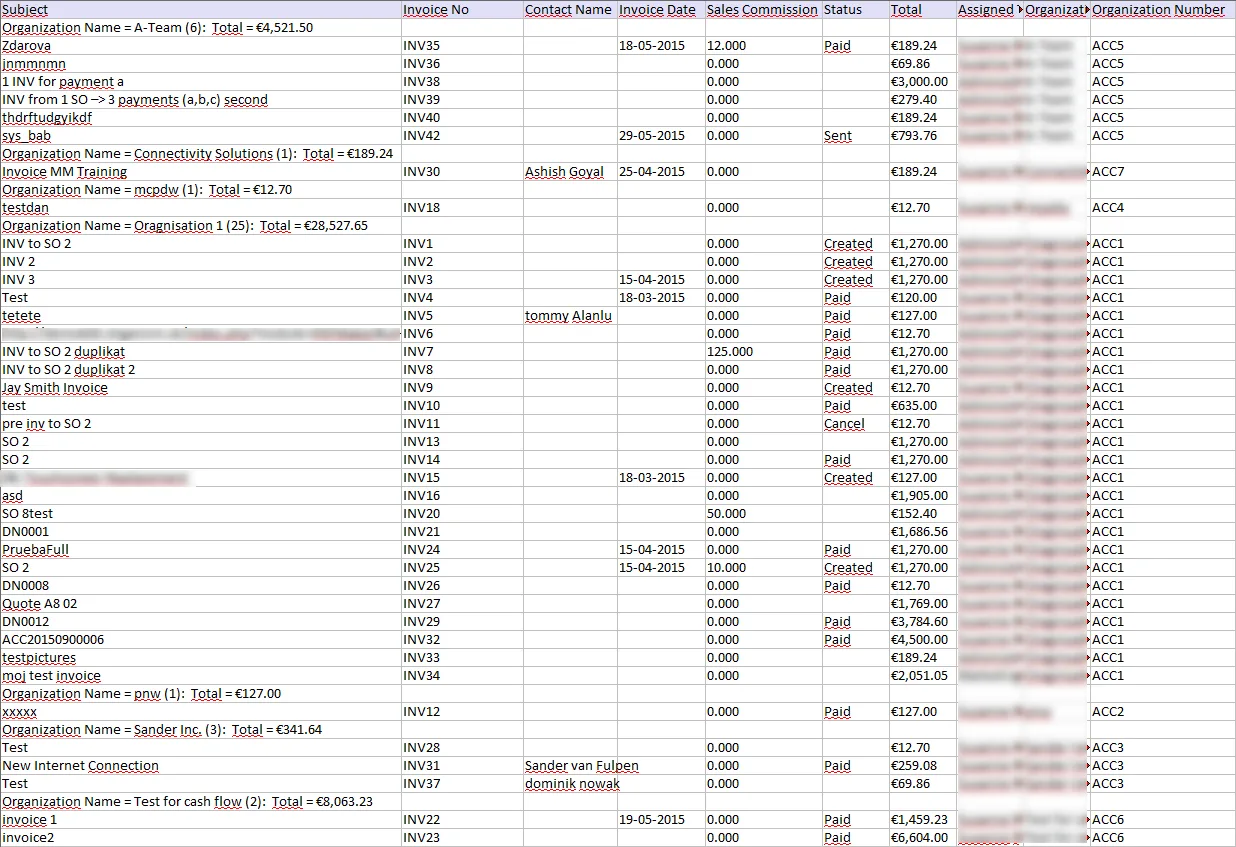
With Reports 4 You you can also save your Reports as Excel files. To save click on  button.
6.1.2.1 Currency column Disable/Enable
Some users prefer to not show this column in .xls exported files.
So here we will show you how to hide it:
- Go to vtigerfolder/modules/ITS4YouReports/configs/env/
- Create file with name XlsCurrencyColumn
– should be like : modules/ITS4YouReports/configs/env/XlsCurrencyColumn - Open the file and write in the value 0
– write it just as 0 without anything else
0 – currency column not shown
1 – currency column shown
Now the Currency column will be not showm in the exported .xls files.
6.1.3 AVG Calculation without empty values
Users which want an Average calculations without empty values or zero values can use this quick tip from us.
- Go to vtigerfolder/modules/ITS4YouReports/configs/env/
- Create file with name UseEmptyRowsCount
– should be like : modules/ITS4YouReports/configs/env/UseEmptyRowsCount - Open the file and write in the value 0
– write it just as 0 without anything else
0 -counts the AVG value with COUNT rows where the value is not empty
1 – counts the AVG value with COUNT rows where the value is empty
This configuration affects tabular report calculations.
Summaries report calculations are calculated by MySQL queries and user can simply filter off empty values there.
6.2 Support of Multi Company
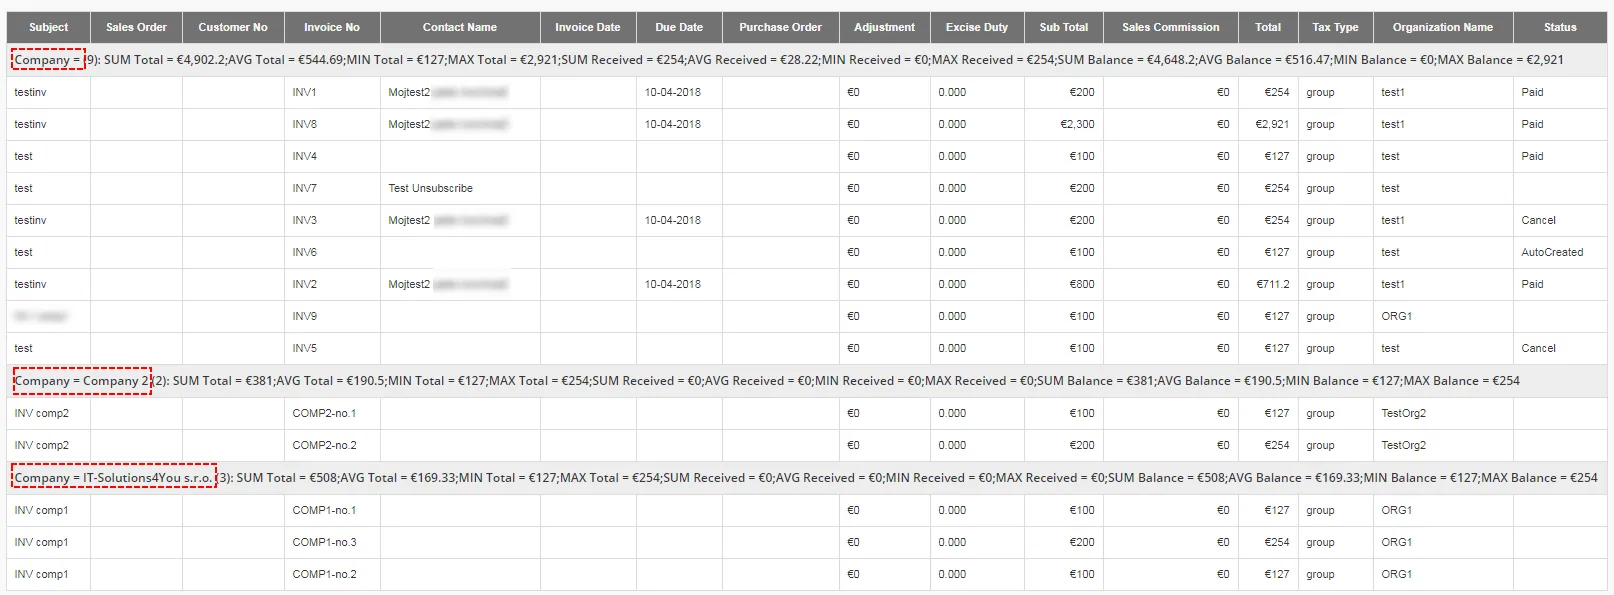
With Reports 4 You you are able to generate your Reports across your Companies created by Multi Company extension.
Multi Company is extension tool designed by ITS4You for vTiger CRM which allows you in easier way to manage your companies within one vtiger CRM installation..
For more info about Multi Company please read: www.it-solutions4you.com/multicompany-extension-vtiger-crm
How to create Report based on Companies created by Multi Company you can find in our Tips & tricks
6.3 Key Metrics
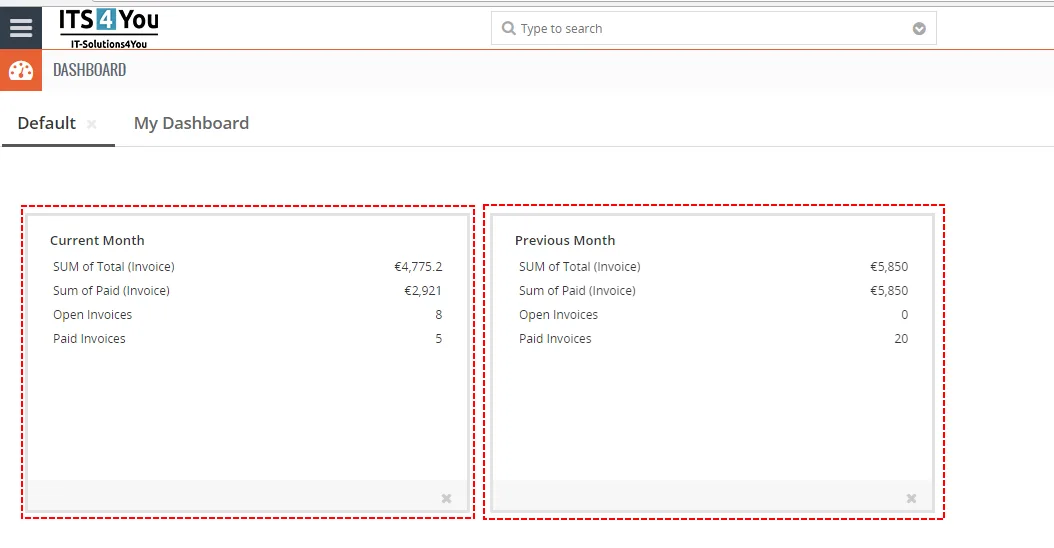
The useful functionality of Reports 4 You is Key Metrics. Key Metrics allows you create Views on Dashboard(s) with information like Count of records based on Filter.
Extended version of Key Metrics included in Reports 4 You allows, after creating Tabular Report, use these Metrics ( SUM, AVG, Min, Max) on Dashboard(s).
6.3.1 How to create and add Key Metrics on Dashboard?
To create Key Metrics please provide following steps:
- Open Reports 4 You and click on


Key Metrics – Reports 4 You Vtiger 7 - Now, you can see list of your Key Metrics.
- To edit or delete Widget click on

- To add Key Metrics Row to show on Widget please click on Name of Widget
- to add new Widget click on
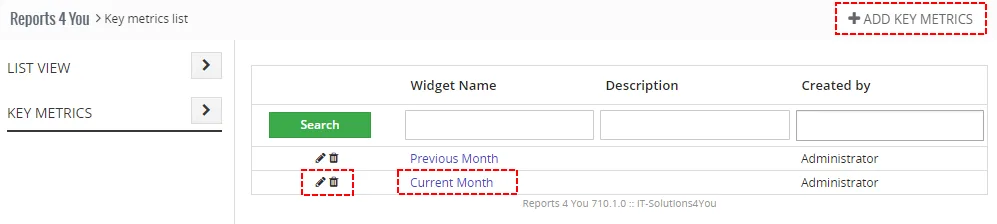
Key Metrics ListView – Reports 4 You Vtiger 7 - To edit or delete Widget click on
- Click on insert Widget name and also you can insert Description and save it.
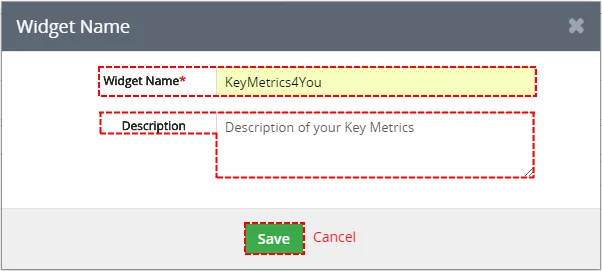
Add Key Metrics – Reports 4 You Vtiger 7 - Next step, is adding Key Metrics Row to calculate. Please click on Name of Your Widget
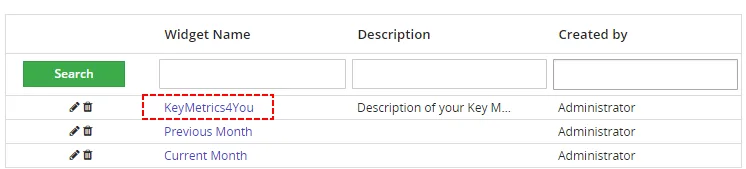
Add Key Metrics Row – Reports 4 You Vtiger 7 - Click on


Add Key Metrics Row – Reports 4 You Vtiger 7 - Insert
- Label – Name
- Report Name – you can choose filter or tabular Report
- Column – if you choose only filter then you can select only Count of Records. If you choose tabular Report then you can select SUM, AVG, Min, Max from this Report
and save it.
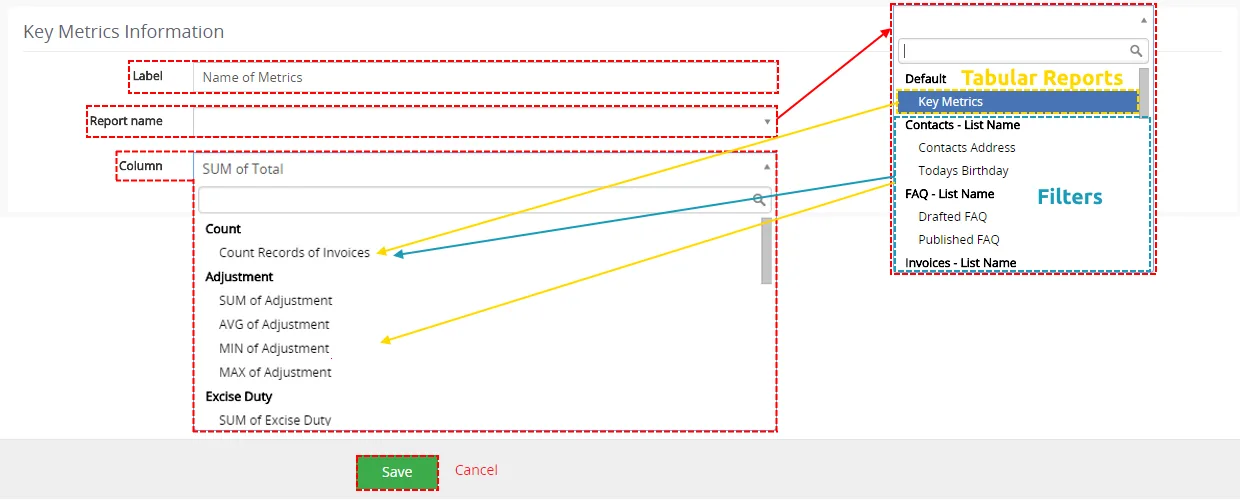
Add Key Metrics Row – Reports 4 You Vtiger 7 - Now, you can repeat step 6 like you need.

Add Key Metrics Row – Reports 4 You Vtiger 7 - To add Widget on Dashboard visit Home Dashboard, click on
 and find Name of Your Key Metrics.
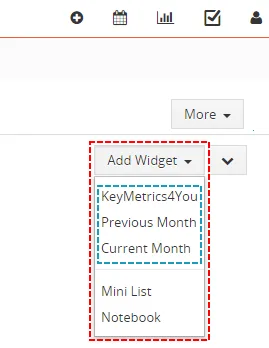
Add Key Metrics on Dashboard – Reports 4 You Vtiger 7
note
6.4 Dashboard
How to add Widget on Dashboard?
- Open your Dashboard, click on button and find your Name of Report
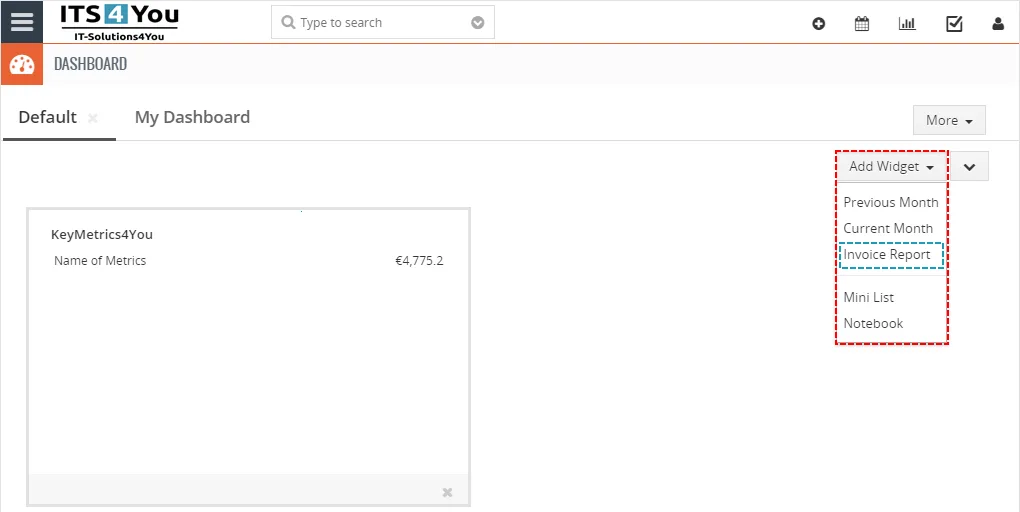
Add Widget on Dashboard – Reports 4 You Vtiger 7 - Now, you can see your Widget on Dashboard.
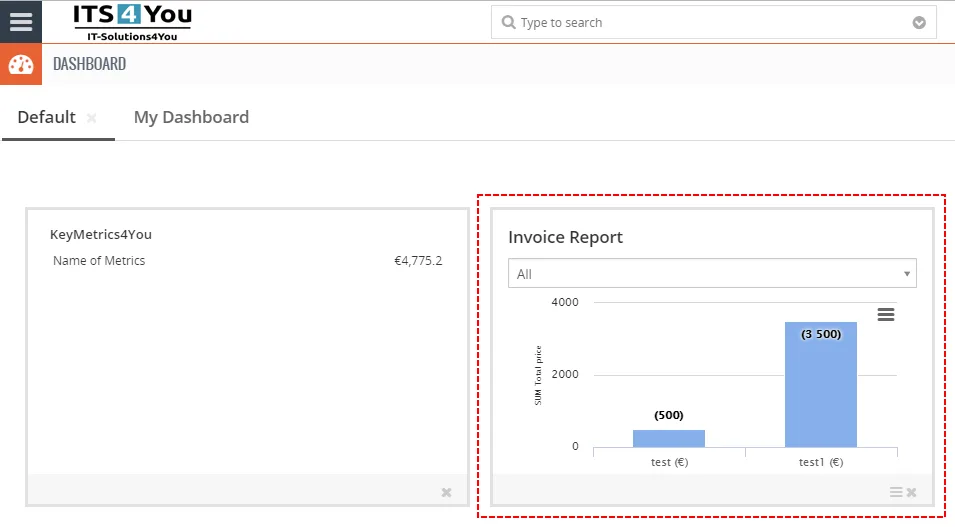
Add Widget on Dashboard – Reports 4 You Vtiger 7
 Notice for Vtiger 6.x users: Since the version of Reports 4.3 there was fixed a bug, where you were not able to increase the size of Reports 4 You Widgets in Vtiger 6. x, because it has got no option to resize it by default itself.
So if you are facing this issue, please update your Reports to the latest version via Installer.
6.5 Print
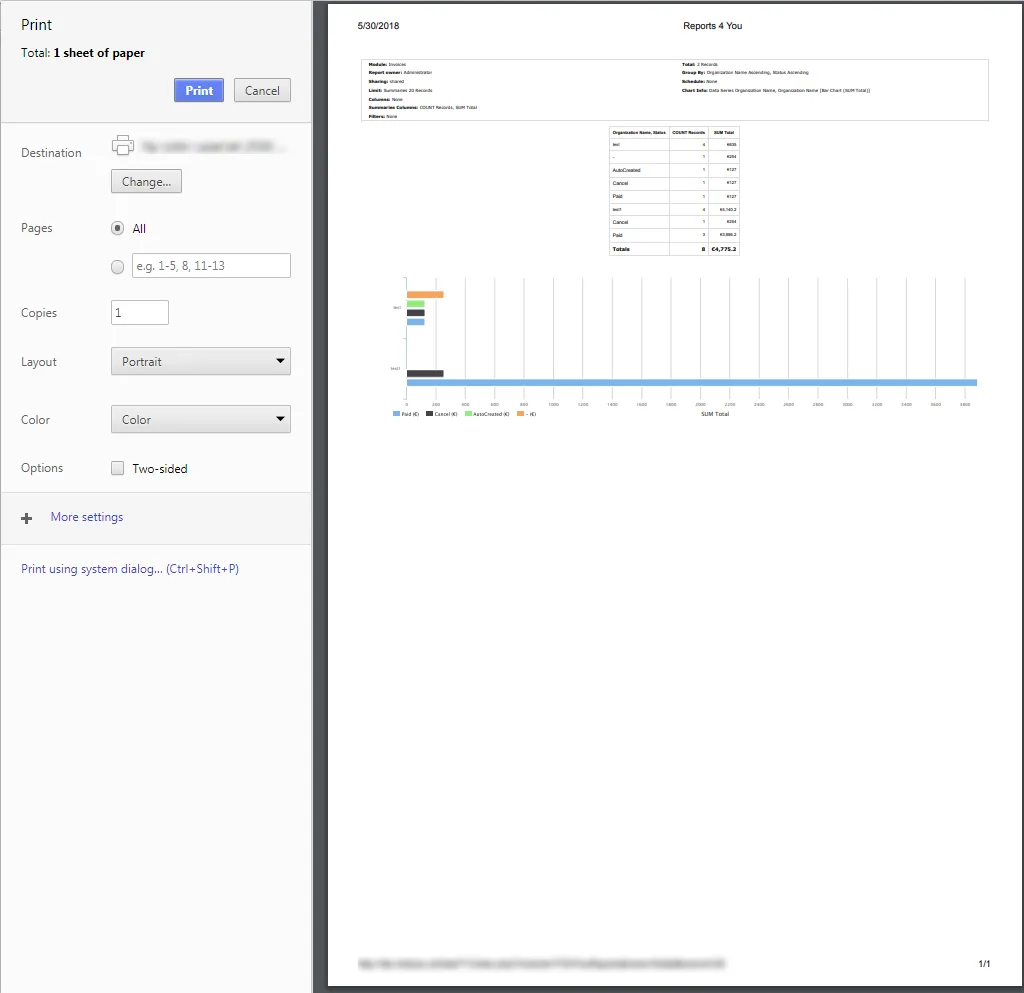
There is also option to print your Reports directly from Vtiger CRM as well as print end export Charts. Click on 
6.6 Bing Maps
With the version of reports ITS4YouReports_2_8_0 and higher. You are able to use Bing maps with our reports!
- To start using Bing maps you need to create API Key. You can do that by going into Reports module, then click on the button
 and select “API Key Settings”.
- You must create key for Default usage or users can have their own key. How to get the Bing Map Key simply click on this URL text, see image below:

- You will be redirected to the guide how to get a Bing Maps Key. Obtain key and choose if you want it for Default or User defined and paste the key in the window. Then “Save”.
After you successfully created and applied Bing Map Key, you can proceed to create or edit your reports. When you are creating report you have a step called “Maps” see image below:
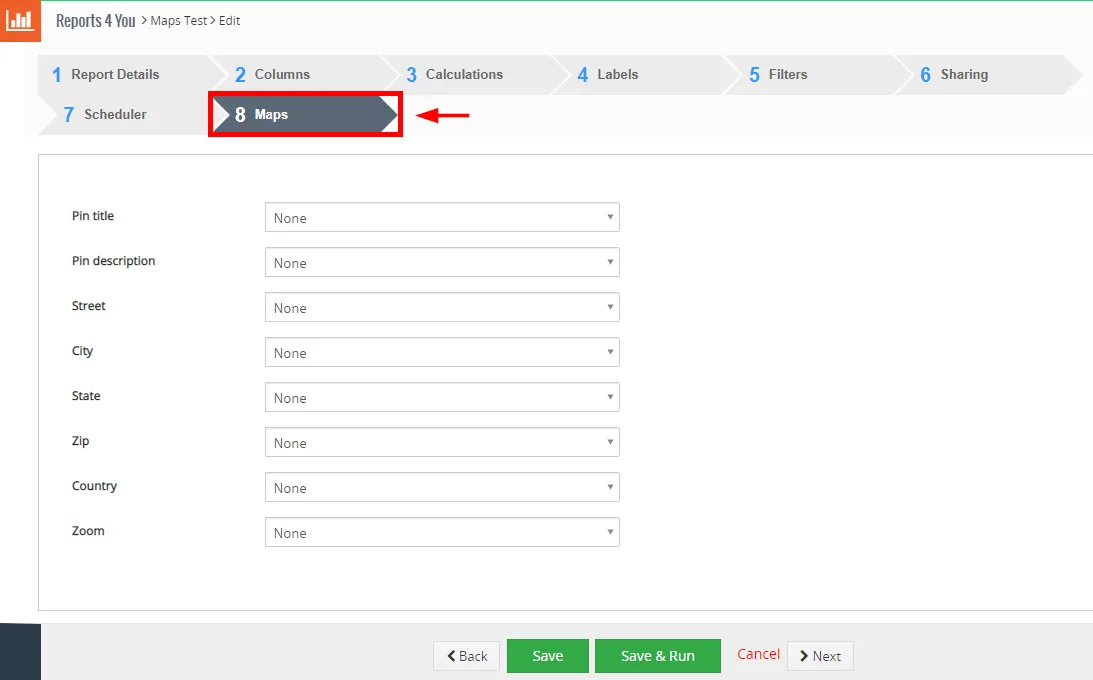
You will have to select mapping for the fields in this step, explanation of the fields is below:
- Pin title – title for the pin which will be shown on the map, select any value from the pick list
- Pin description – select field which will be used as description
- Street – select street field, for example Billing Street
- City – select city field, for example Billing City
- State – select state field, for example Billing State
- Zip – select postal code/zip field, for example Billing Postal Code
- Country – select country field, for example Billing Country
- Zoom – how much zoomed your map will be (optimal is 7)
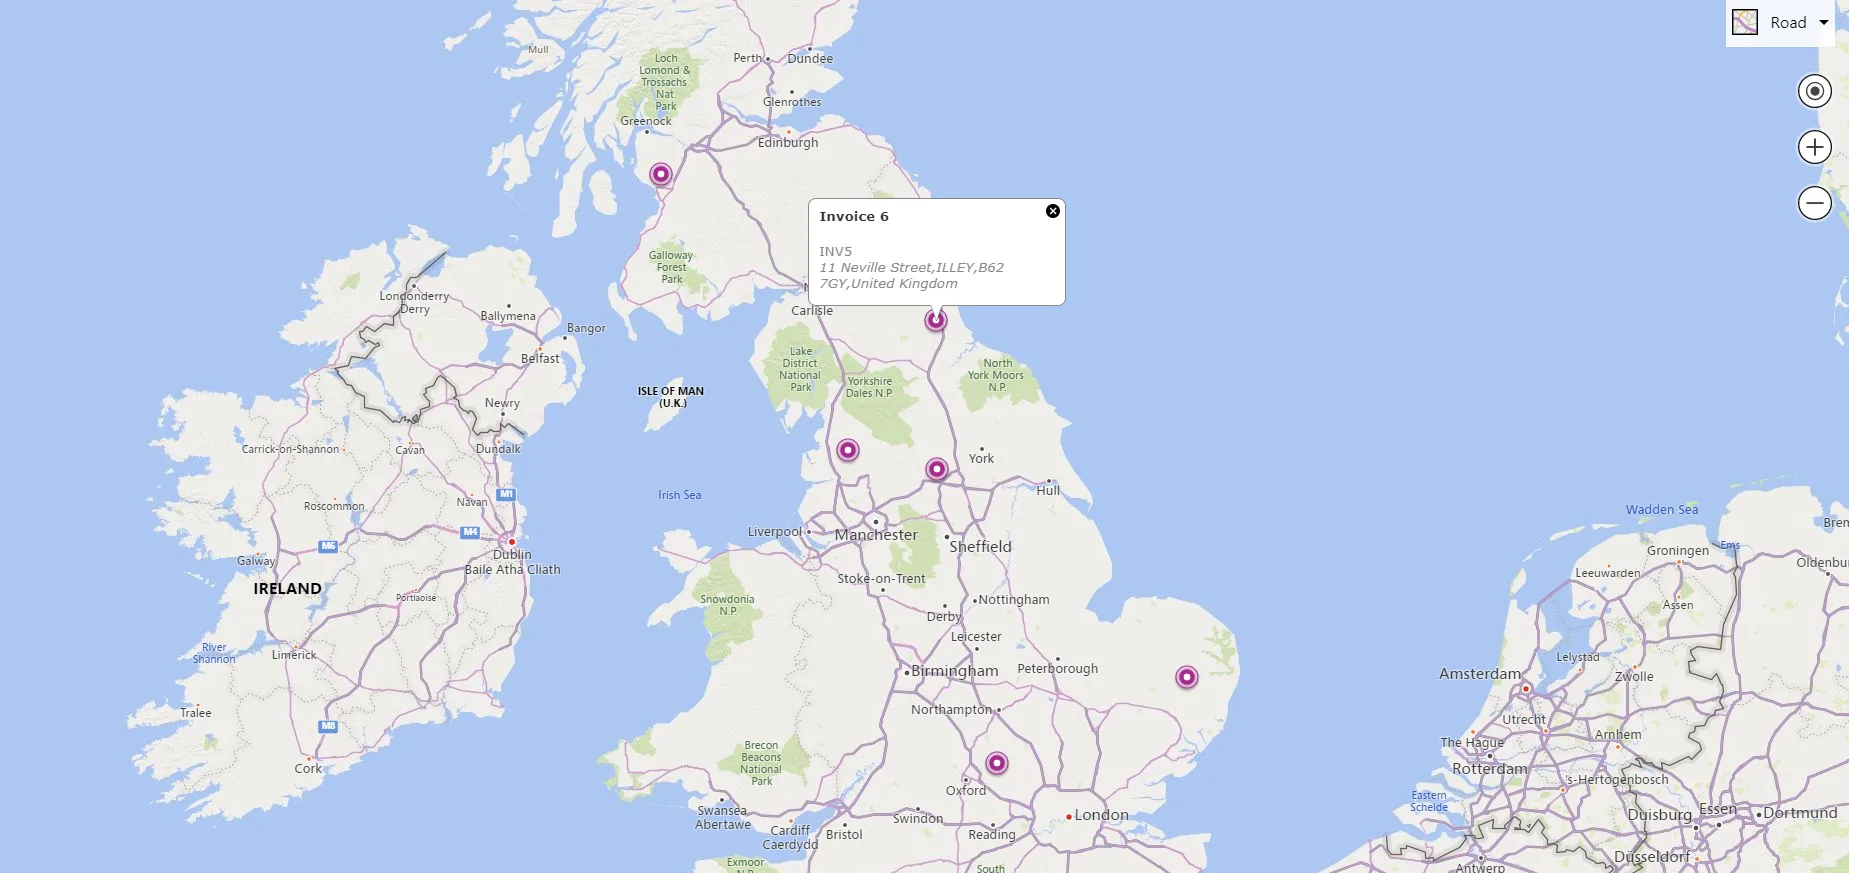
When you are done with “Maps” step, proceed with generating reports. In the detail view of the report, please click on the “Display Map” button like it’s shown on the image below:

The result is that our Invoices are shown on the map based on the Billing details used:
Need help with Reports 4 You?
Our support team answers questions about installation, templates and settings.