

The Work Area of the Reports 4 You consists of:
- ListView – used for common tasks like add new, edit, duplicate and delete Reports, and access to others tools
- DetailView – shows already created Reports in details
- EditView – allows the preparation of the new report or editing existing reports
5.1 ListView
The common tasks like add/delete Reports or start editing have to be initiated via Reports 4 You ListView. Go to All → TOOLS → Reports 4 You and Reports 4 You ListView will appear on your screen.
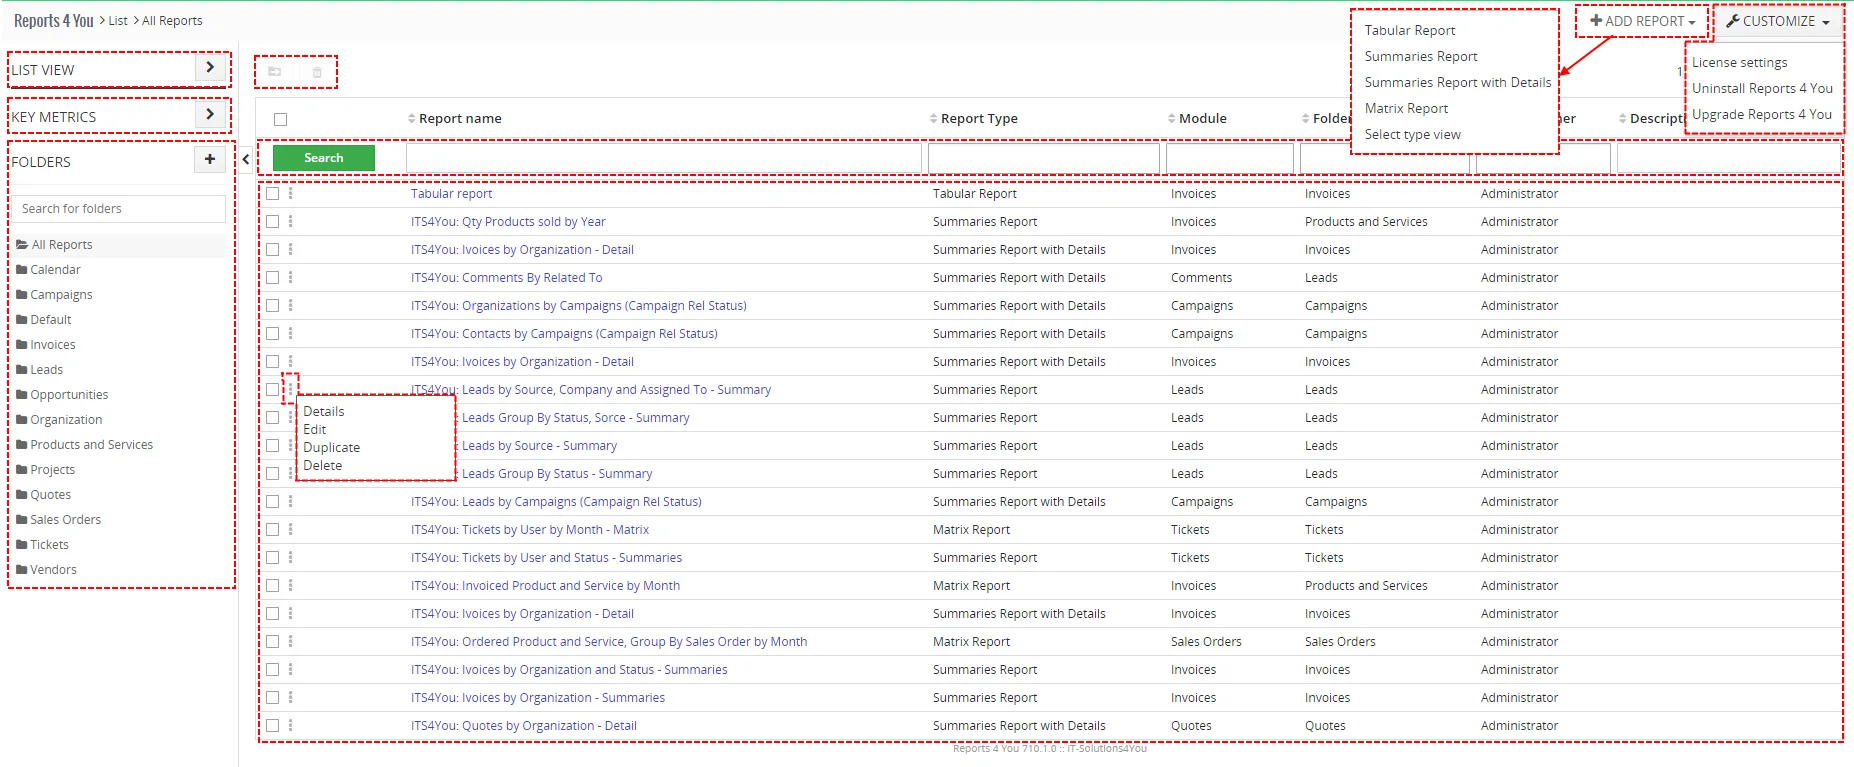
The main part of the Reports 4 You ListView consists of list of the Reports, which gives you information about a Report name, Report Type, Module, Folder Name, Report owner and Description of Report. As shown in the picture, above the list of the reports you can find following:
ListView of Reports 4 You consists of:
 contains actions for switch to DetailView, edit, duplicate or remover Reports
 is used to add new Reports
 is used to add new Folder
 provides options to search your Reports
 next/previous page of Reports
 is used for License setting, Uninstall and Upgrade option
 to move or delete Reports
 open ListView of Key Metrics (read more about Key Metrics)
5.2 DetailView
From ListView you can directly open any Reports 4 You in DetailView.
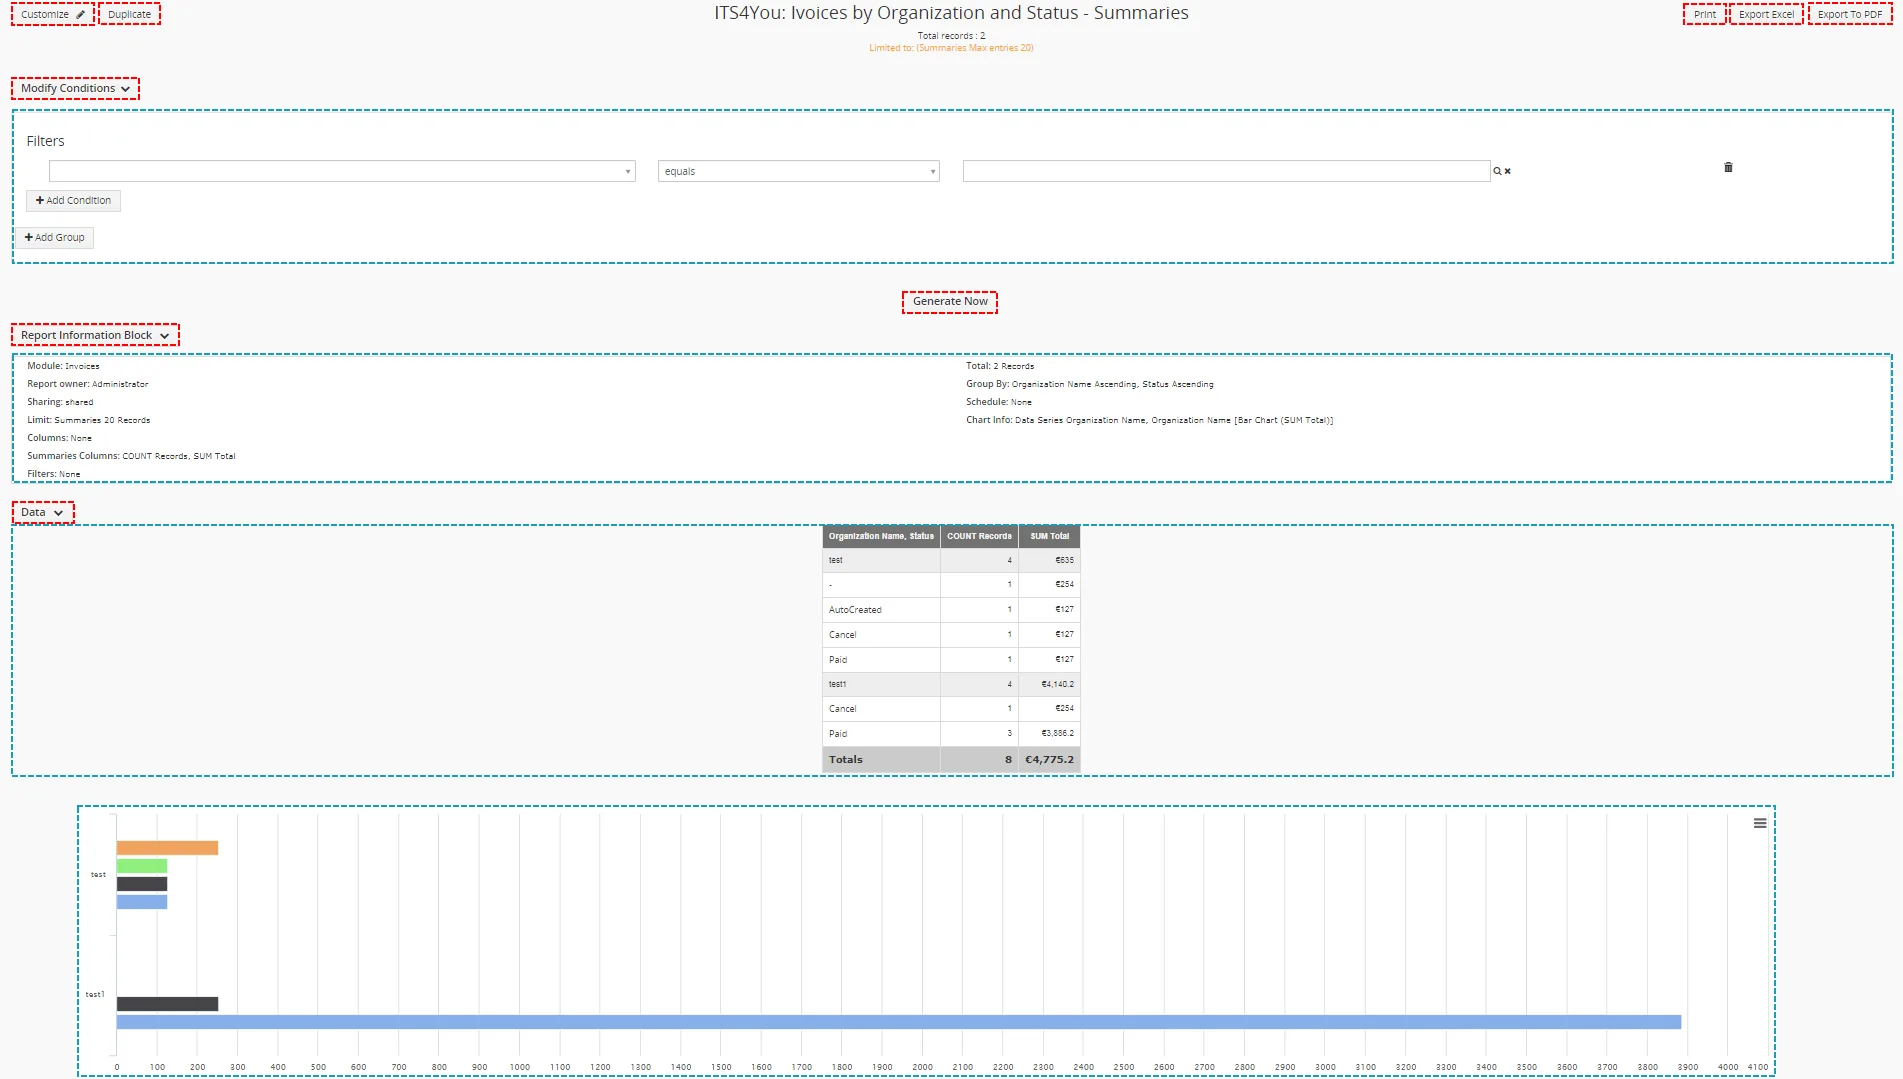
The DetailView consists of:
- Report details part
- Information Block
- Data Block
- Chart part
- Report filters part
- Group of action buttons
 open EditView of Report
 to duplicate Report
 allow to print Report
 allow to export your Report to Excel format
 allow to export your Report to PDF file
 generate your Report again
 show/hide Filter options
 show/hide Report Information Block
 Show Data
 to save Report
5.3 EditView
The EditView shown in the picture below allows the preparation of the new Report or editing existing Reports. The main utilization of the EditView is in the additional correction of the Report. The EditView is divided into three parts:
- Tabs of Report – here you can select which part of Report you want to edit
- Buttons parts – there are buttons: Cancel, Save, Save & Run, Back/Next tab
- Box of tab´s option – here you can edit your Report
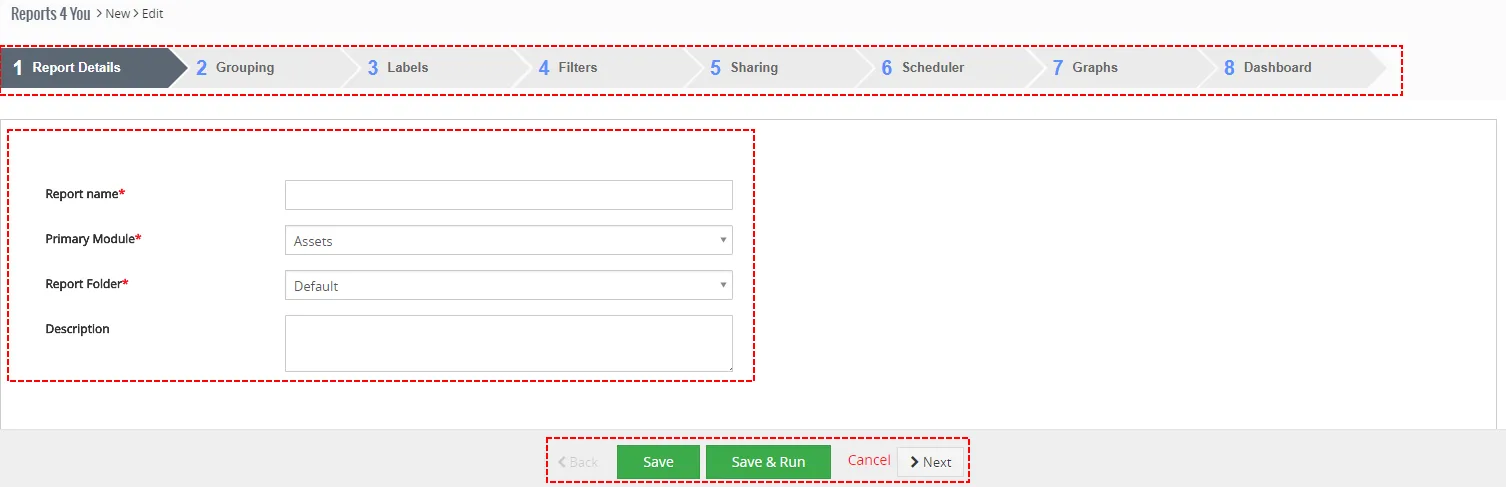
EditView consists of 12 tabs (some are available only for specific type of Report):
- Select Report Type
- Report Details
- Report SQL
- Grouping
- Columns
- Calculations
- Labels
- Filters
- Sharing
- Scheduler
- Graphs
- Dashboard
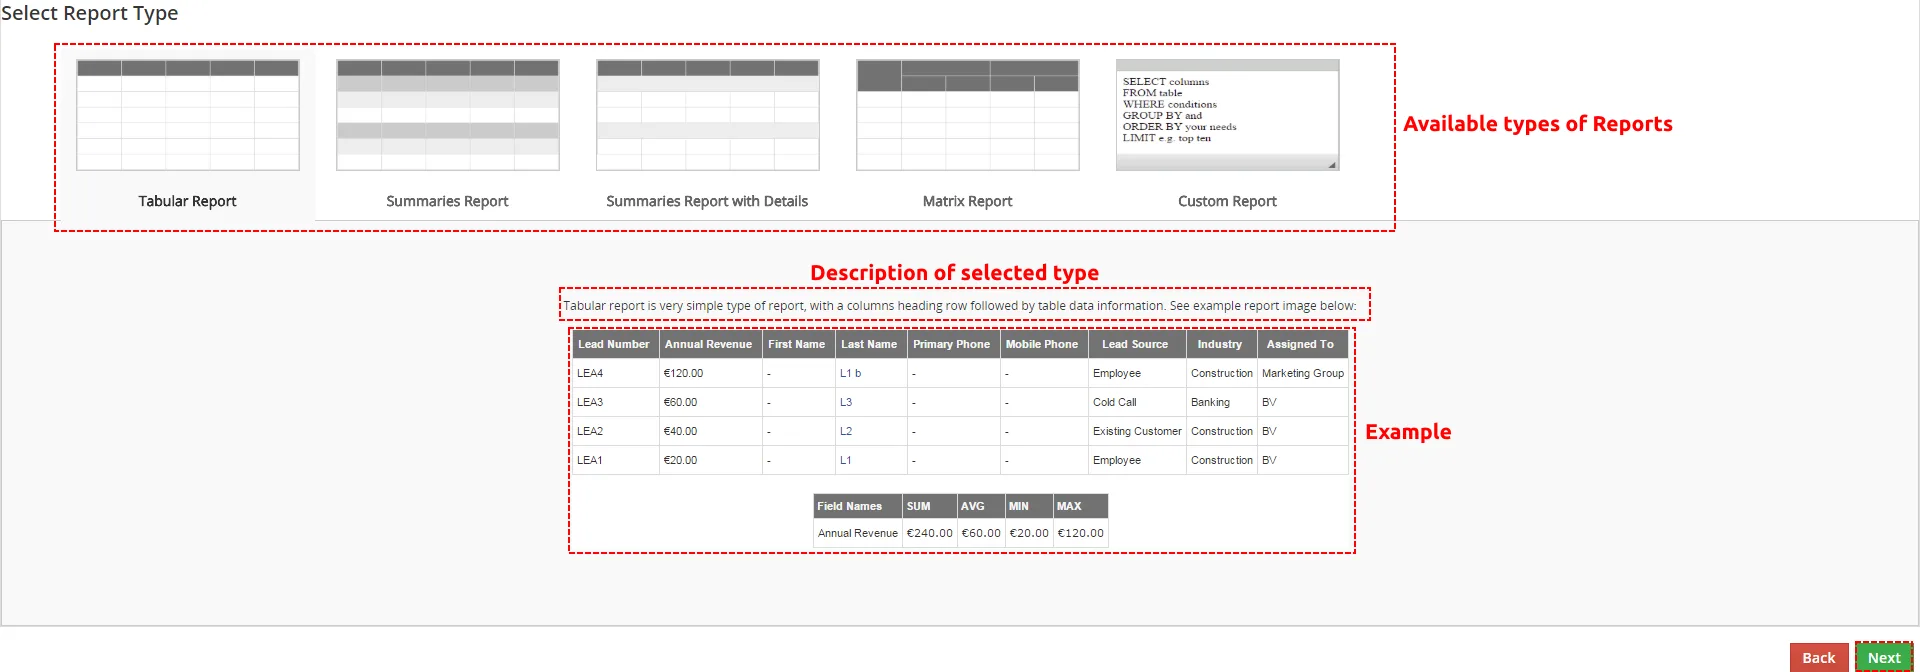
5.3.1 Select Report Type
Now, you can choose type of Report you want to create and click on . To see differences between types of Reports please check chapter Types of Reports.
5.3.2 Report Details
In Report Details, you will have to provide basic Report information.
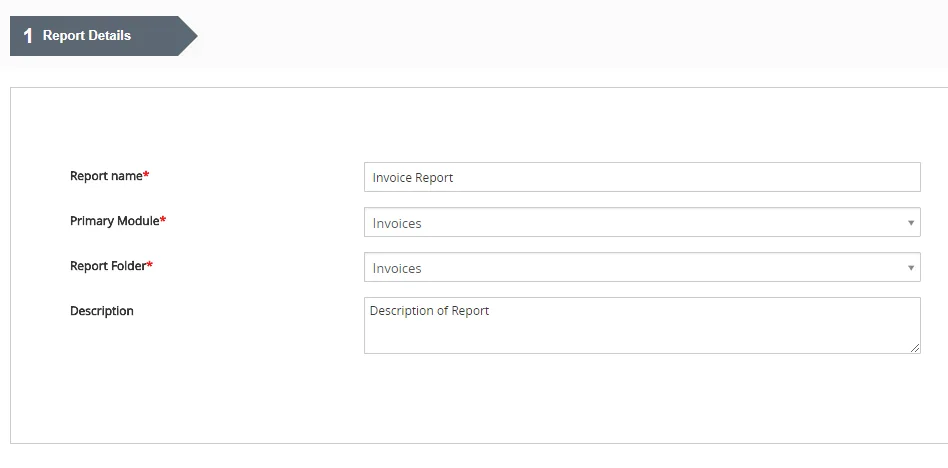
| Name | Description |
|---|---|
| Report Name | Name of your Report |
| Primary Module | Module from which you want to create Report (After first module selection you will be not allowed to change it) |
| Report Folder | Folder which will contain Report |
| Description | Description of Report |
5.3.3 Report SQL
Report SQL is available only for Custom SQL Report.
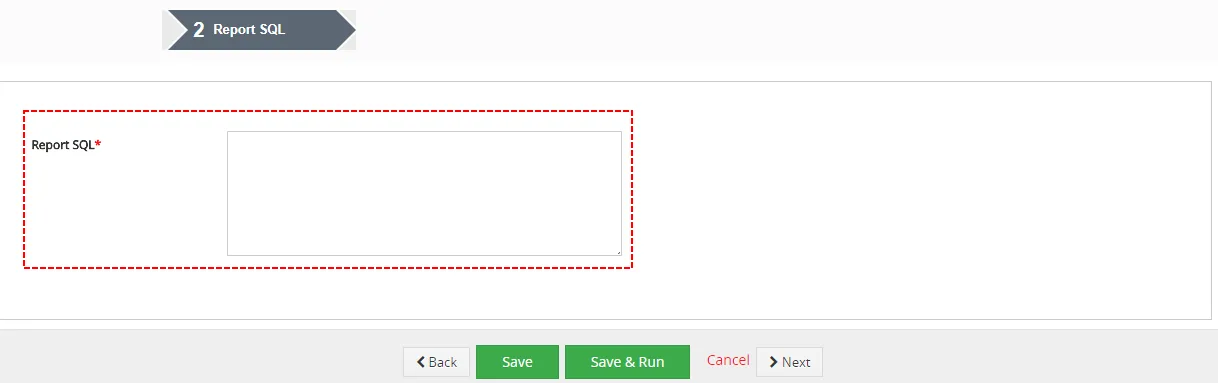
| Name | Description |
|---|---|
| Report SQL * | Place for your custom SQL |
5.3.4 Grouping
This step provide in case you want to Summaries Report, Summaries with details and Matrix Report.
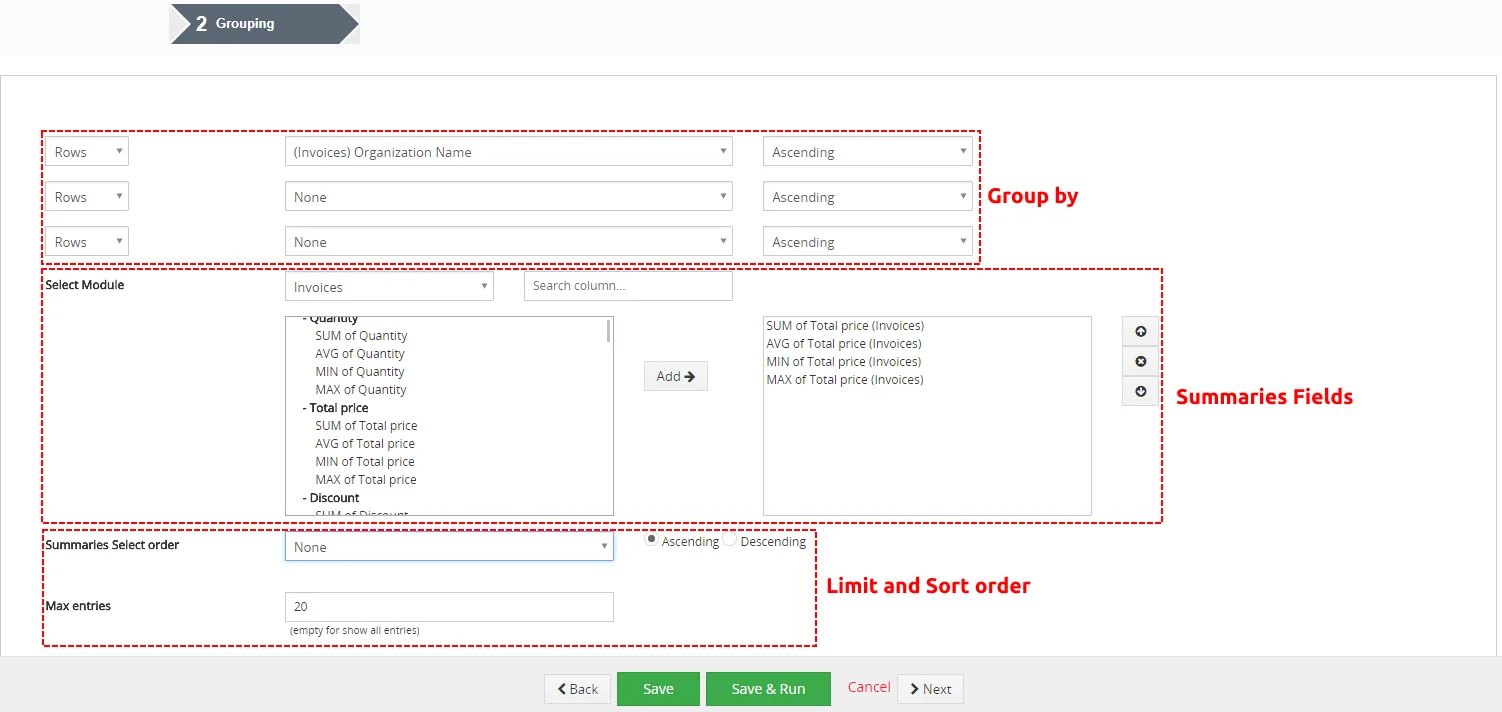
Group by
here you can define by which fields will be your Report grouped. You are able to choose other fields to group by. There are two option (Rows or Columns). Columns you can choose if you select Matrix Report. You can also define how should be your Report ordered (Ascending/Descending).

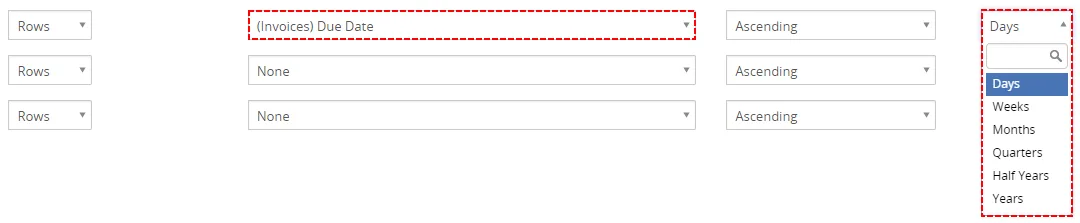
There is also good option to choose date and group by date based on days, weeks, months, quarters, half years and years.
Summaries Fields
You can show SUM, AVG, Min, Max of Available Summaries Fields.

Limit and Sort order
allows you to limit and order grouping records.

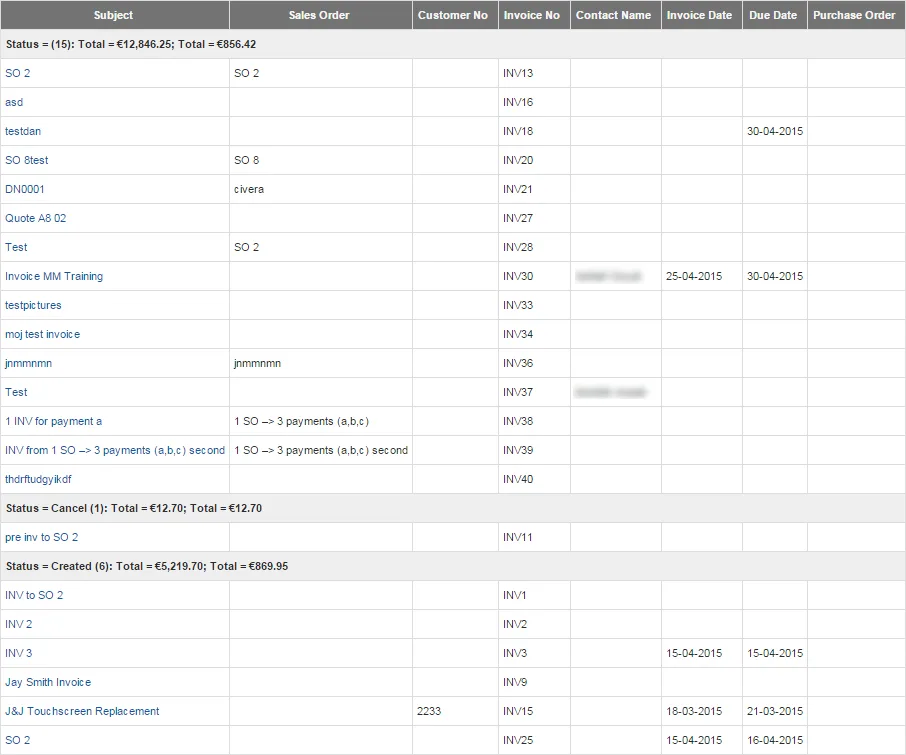
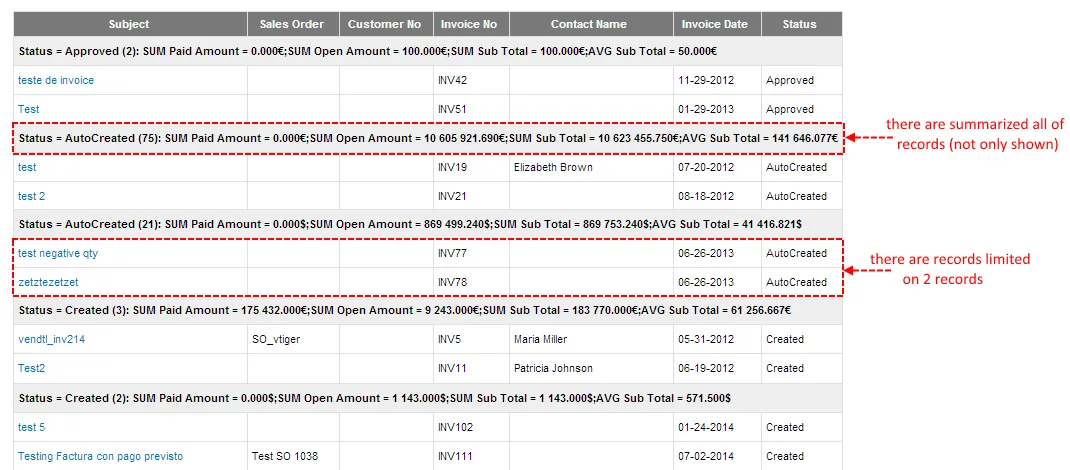
Here you can see how to looks like if you have Limit set on e.g. 3. If you want to limit number of record set limit also in Select Columns part.
5.3.5 Columns
You can use it in Tabular report and Summaries Report with details.
In this step, you can select the fields to display in report with details. These fields can be selected from the Report module selected in Report Details and its related modules. Please choose one of available module from “Select Module” options and for easy navigation write part of field name in search input box. Limit and Sort order block allows you to limits and order detailed records. There is also option to sort by more then One Column.
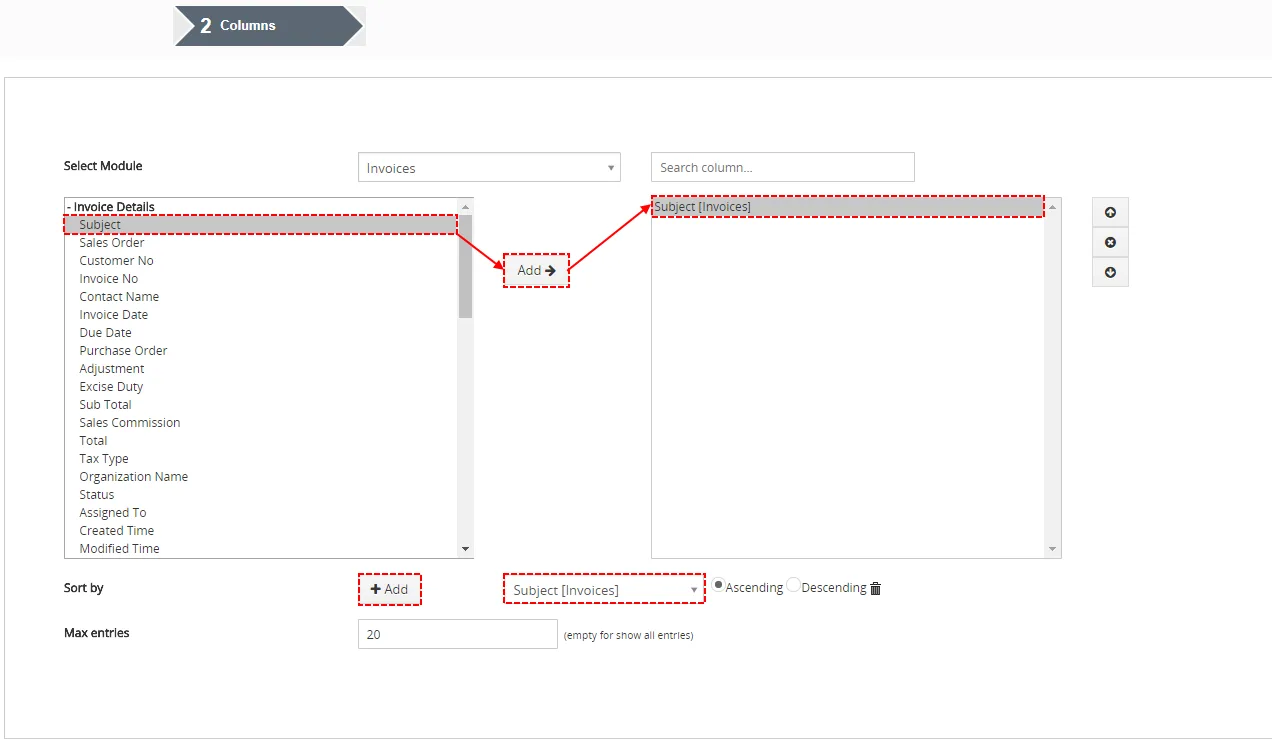
There is also useful option to search fields from chosen and related modules, choosing module and typing name of field.

There is also Limit and Sort order, here you can set how many records are shown. For example, limit is set on 2:

5.3.6 Calculations
Now, you can select the calculations for the fields available across the Report modules and only in Tabular Report. You can select the calculations like SUM, AVG, MIN and MAX values (Numeric Columns: Sub Total, Total, …) across the Report result records.
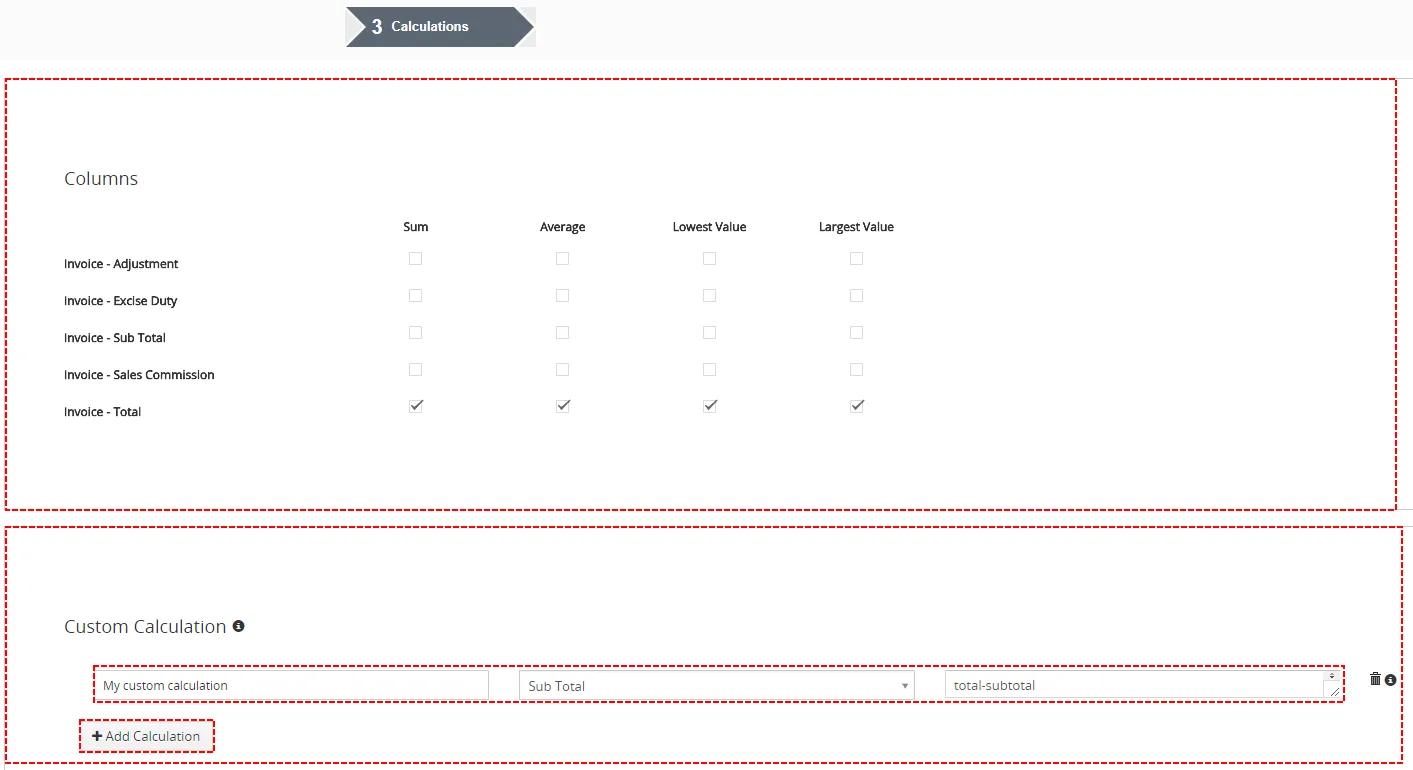
In Custom Calculation you can define expression of custom calculations based on fields available across the Report modules. You can define basic mathematical operations like: + , – , * , / or some other expressions: if … then … else … end (==,<=,>=,<,>) concat( … , … ).
5.3.7 Labels
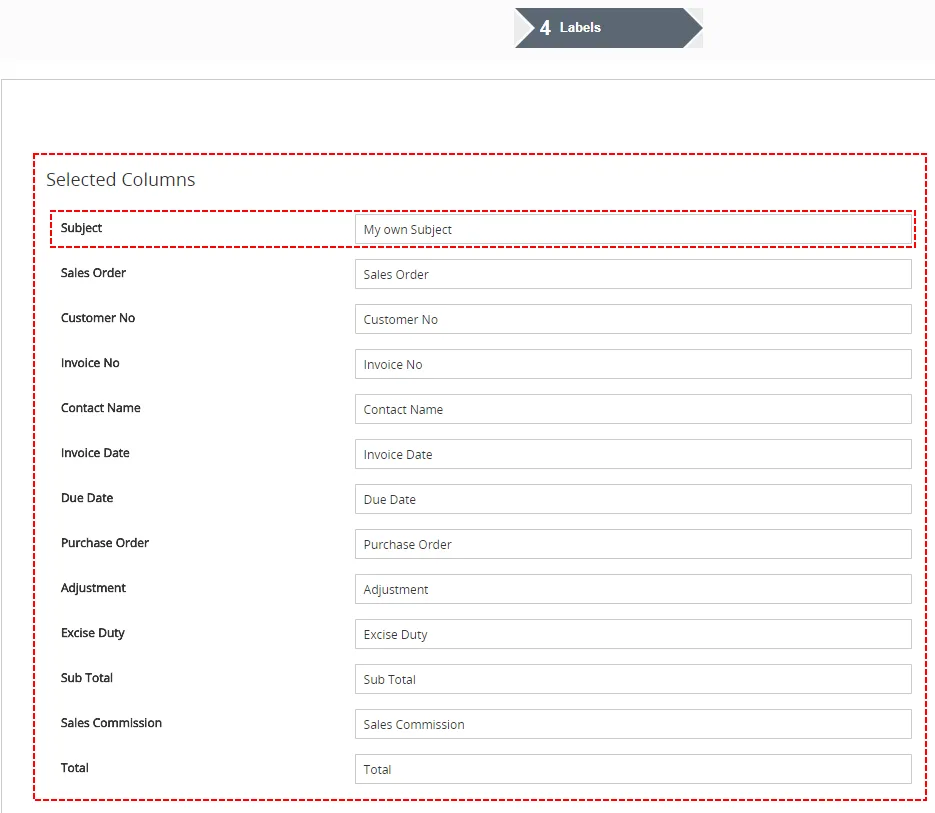
This step gives you the flexibility to customize selected field labels. You can rename Selected Columns how you want.
5.3.8 Filters
In this part, you can specify the conditions to filter the results in a report. You are able to specify conditions in Filters and Summaries Filters. Filters have all the fields from the selected module and its related modules where the comparator and condition can be chosen based on type of field selected. You are allowed to provide unlimited number of conditions, we recommend 5 conditions.
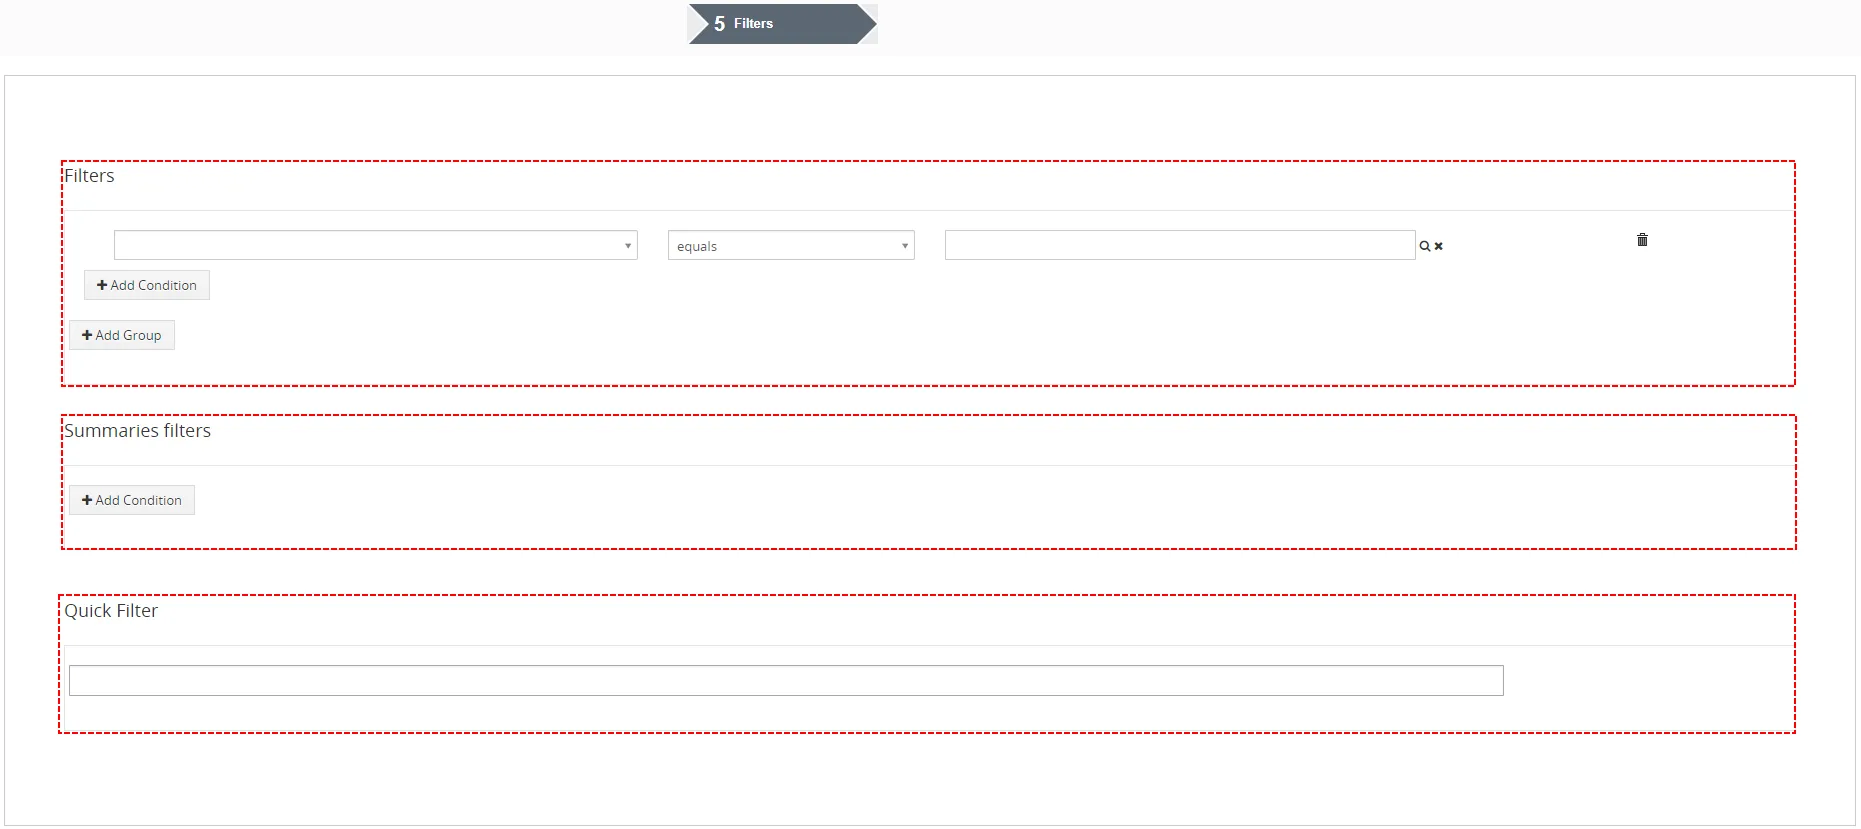
- Filters – here you are able to create Filter, add new Condition to Filter
 or add New Group of Filters
 . Course, there are options to Delete Condition
 as well as Group
 . It is good to note our better comparators for time Columns (e.g. Less then today, More then today,Older than … day,…) and repair some standard comparators(e.g. Last/Next Days N,…). (For example you can use it to Report Invoices that are not paid more then 7,… days). Reports 4 You also allows you to compare 2 variables like (Invoice Date greater then field is Due Date)

Filters – Reports 4 You Vtiger 7 - Summaries filters – powerful option to create Filters from Summaries fields
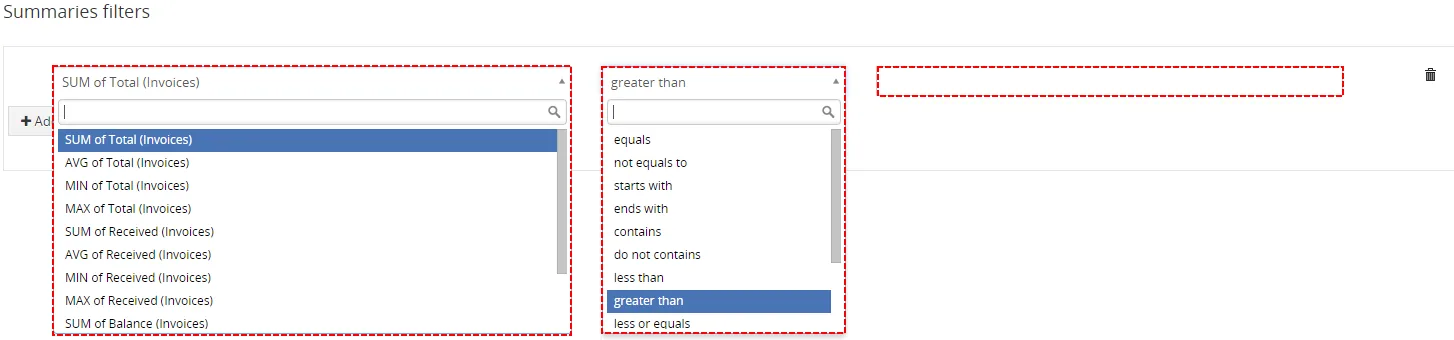
Summaries Filters – Reports 4 You Vtiger 7 - Quick Filter– useful ability to edit quick filter in DetailView of Report
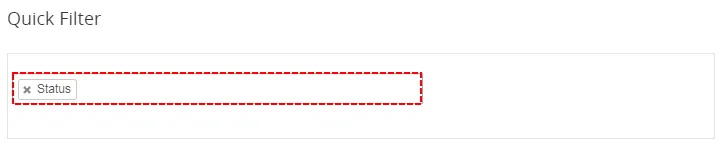
Quick Filter – Reports 4 You Vtiger 7
5.3.9 Sharing
In Sharing part, you can specify the security of the report. Here you can select report Owner and the type of report Sharing Rules (Public, Private or Share) across users in role hierarchy. Report can only be edited by Owner and other users whose roles is higher to the role of Owner.
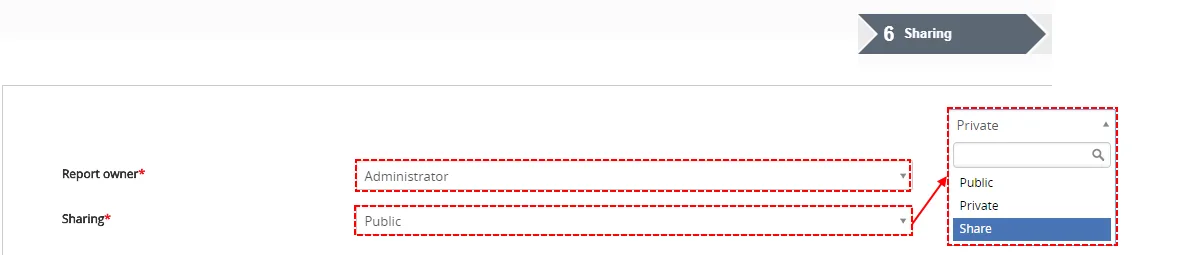
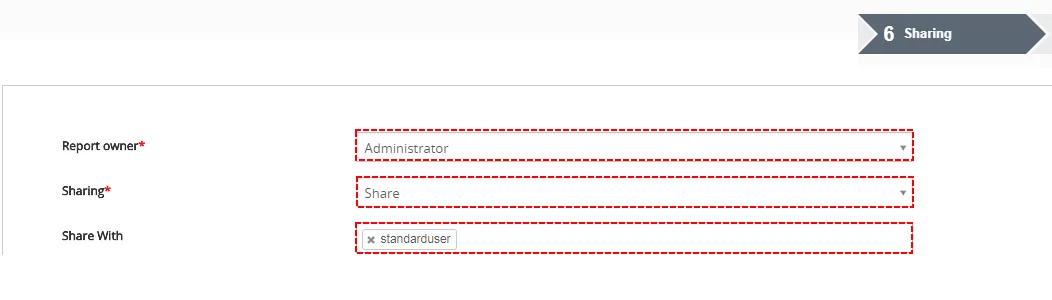
There is also option to setup default sharing options for all created reports.
In the list view of Reports module, click on the button and select “Settings”, the Sharing settings window will pop-up, see below:

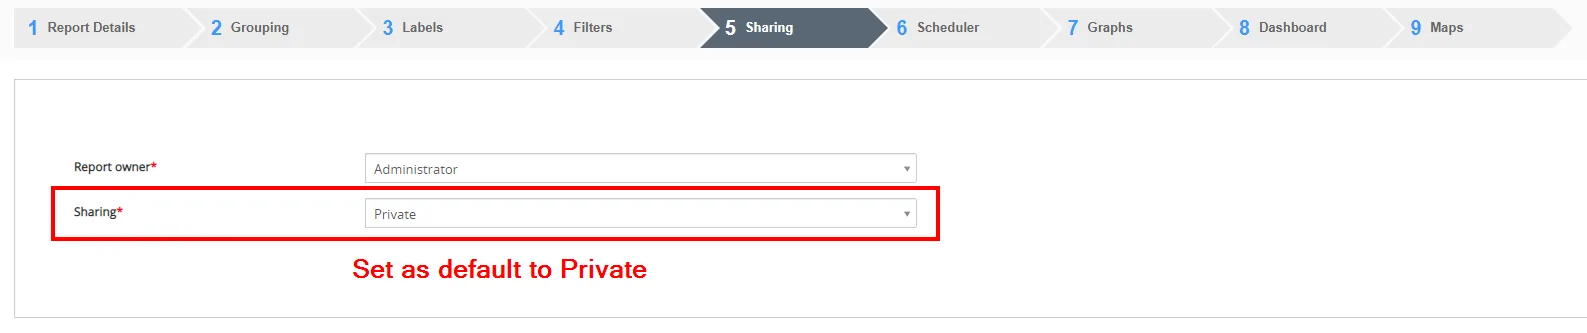
For example, if you set it as “Private” and then save it, all reports you create will be automatically set as “Private” in the Sharing step when creating reports, see below:
5.3.10 Scheduler
In this step, you can Send Reports at regular intervals to specific users through email without logging in to the CRM.
By default is Scheduler inactive. Do not forget to check “Active” to run this report using workflow scheduler.

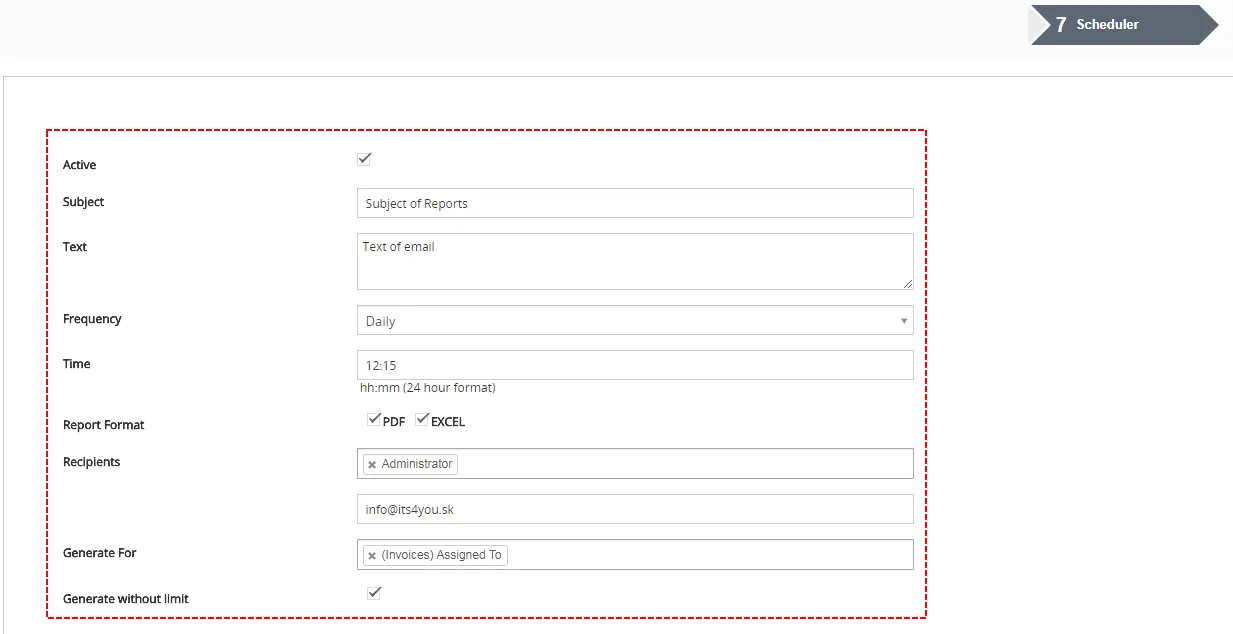
| Name | Description |
|---|---|
| Subject | Subject of Scheduled Email (Auto-generated if empty) |
| Text | Text (Body) of Email |
| Frequency | Frequency of Email sending |
| Time | Time of sending Email |
| Report Format | Format of included File |
| Recipients | You can choose Recipients (Users, Groups, Roles, Roles and Subordinates) |
| Other Emails | Here you can add other mail to CC. |
| Generate For | Based on Generate For Reports 4 You makes and sends Emails to Users based on their own privileges. |
| Generate without Limit | You receive Report without Limit set in Grouping part. In your CRM, Limit is still applied only in Email you will see Report without Limit. |
Differences between Recipients/Other Emails and Generate For
When you choose Recipients/Other Emails, all Users receive the same Reports like Reports Owner based on his privileges (e.g. 1Report to 20Users).
If you choose Generate For, then Reports 4 You send for each User particular Report based on User Field you choose (e.g. 20 Reports to 20 Users).

When you turn on Scheduler for some Reports, in ListView of Report 4 You you can see  at this Reports.
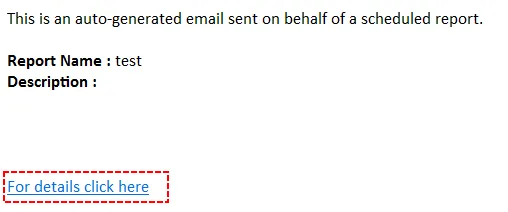
There is also Link to Report Detail included in received email.
5.3.11 Graphs
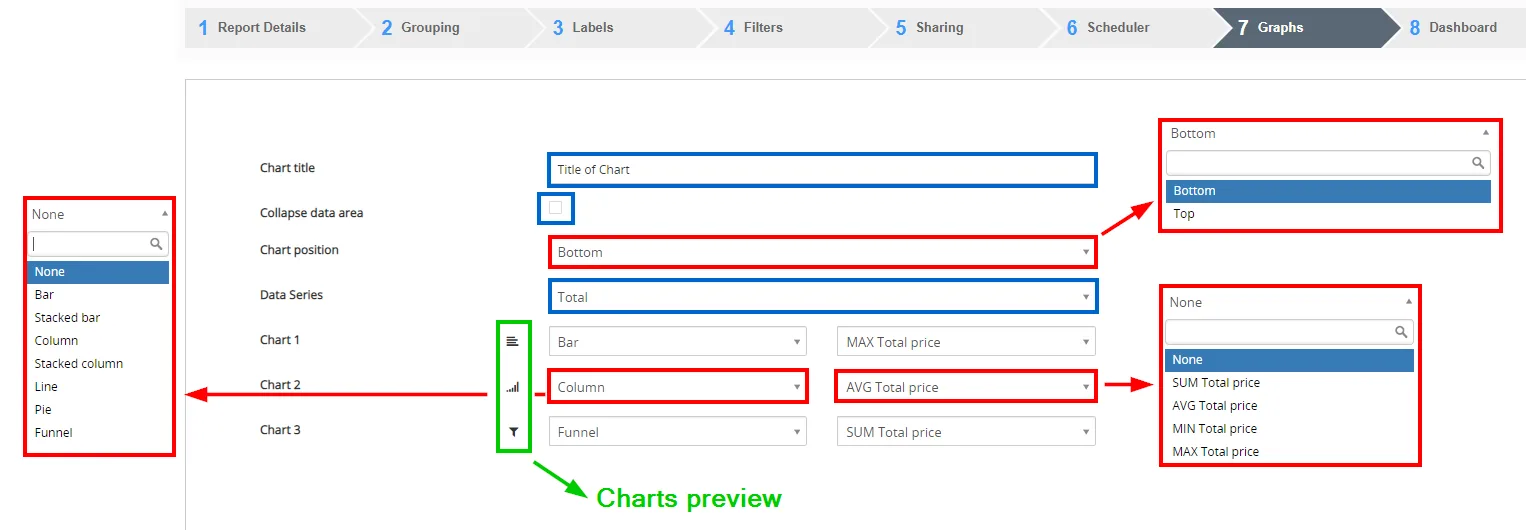
Here, you can define Charts for every Report that is having a “Group by” definition and “Summaries columns”. Data series is using Summaries column values so you can define which one you want to use in charts.
Additionally, you can define Chart title, which is used in output files. Set Collapse data area or not and set Chart position. You are able to create up to 3 Charts. Here you can choose the chart type and Data Series.
Near each Chart type you see also icon as a preview how the chart will look like.
5.3.12 Dashboard
In Summaries Reports, Summaries Reports with Details and Matrix Report if you have Graphs you can use our useful functionality: Dashboards. Dashboards function allow add Widget to Dashboard of some modules and use also Primary search column to filter Graph direct from Dashboard.
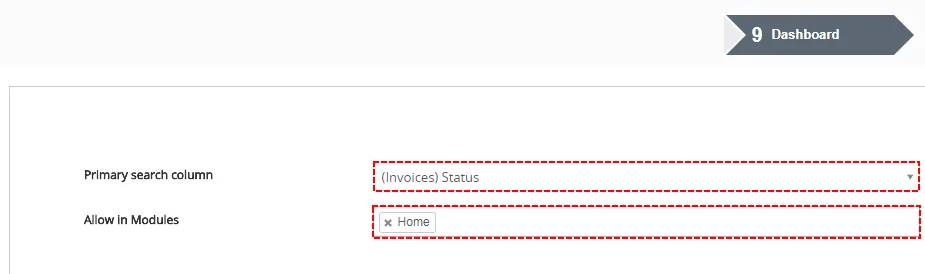
More about Dashboard you can find: Dashboard
Need help with Reports 4 You?
Our support team answers questions about installation, templates and settings.