

In the following sections you can find short description of Report’s types and how to create your first simple Report for vtiger CRM using Reports 4 You and.
Note: The full description of the Reports 4 You menus, tabs and icons can be found in the later chapters.
4.1 Types of Reports
You are able to create 4 types of Reports like Standard User

and 5 types of Reports like Admin User.

4.1.1 Tabular Report
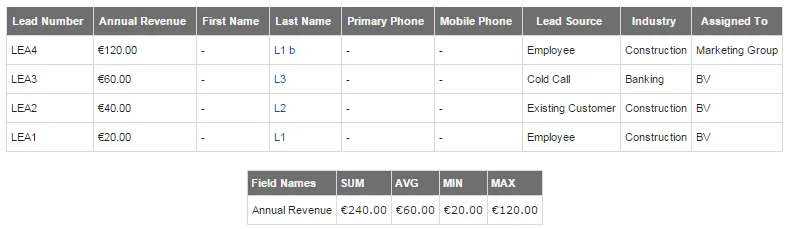
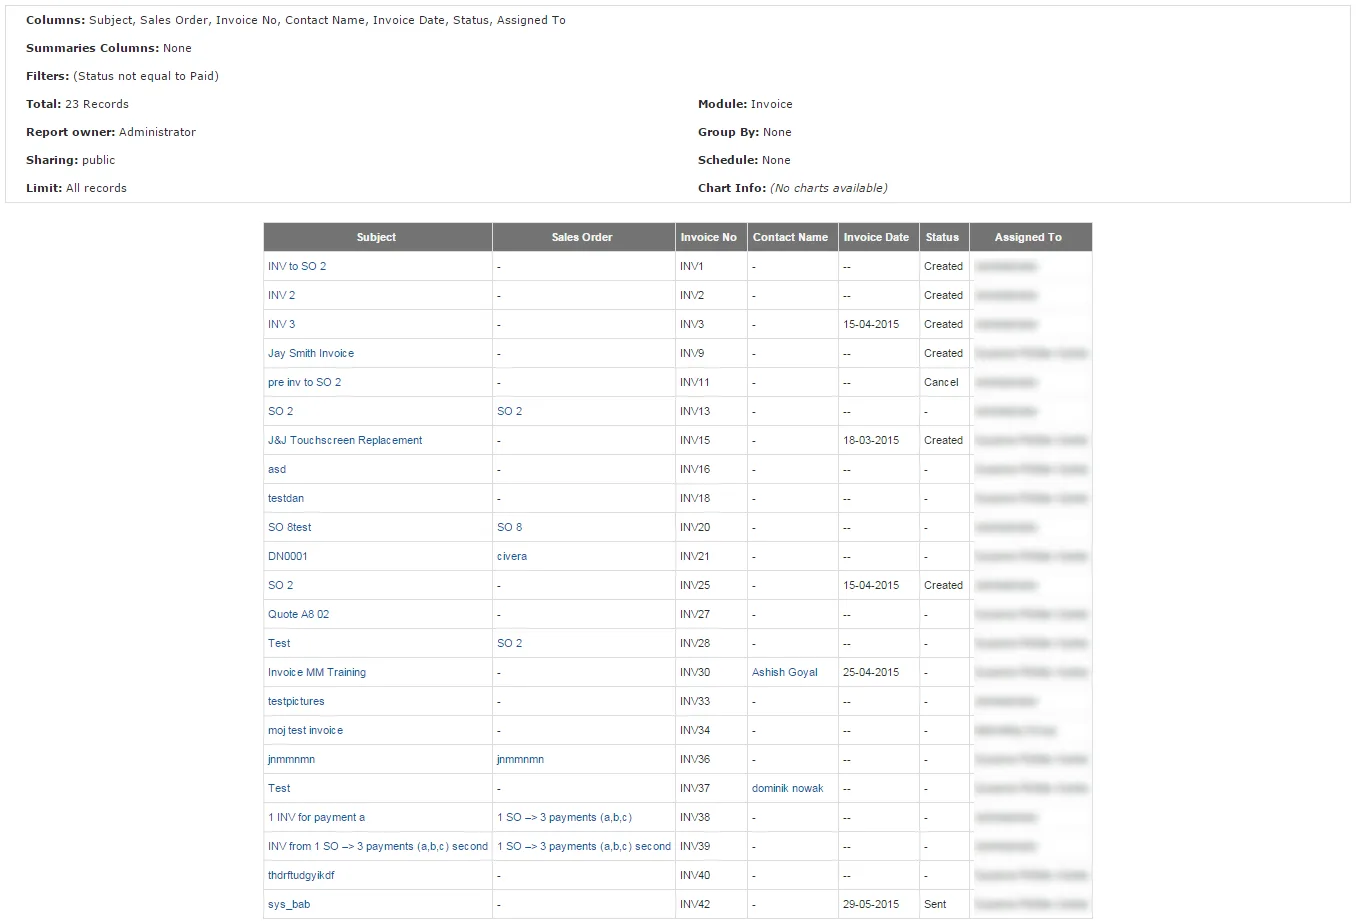
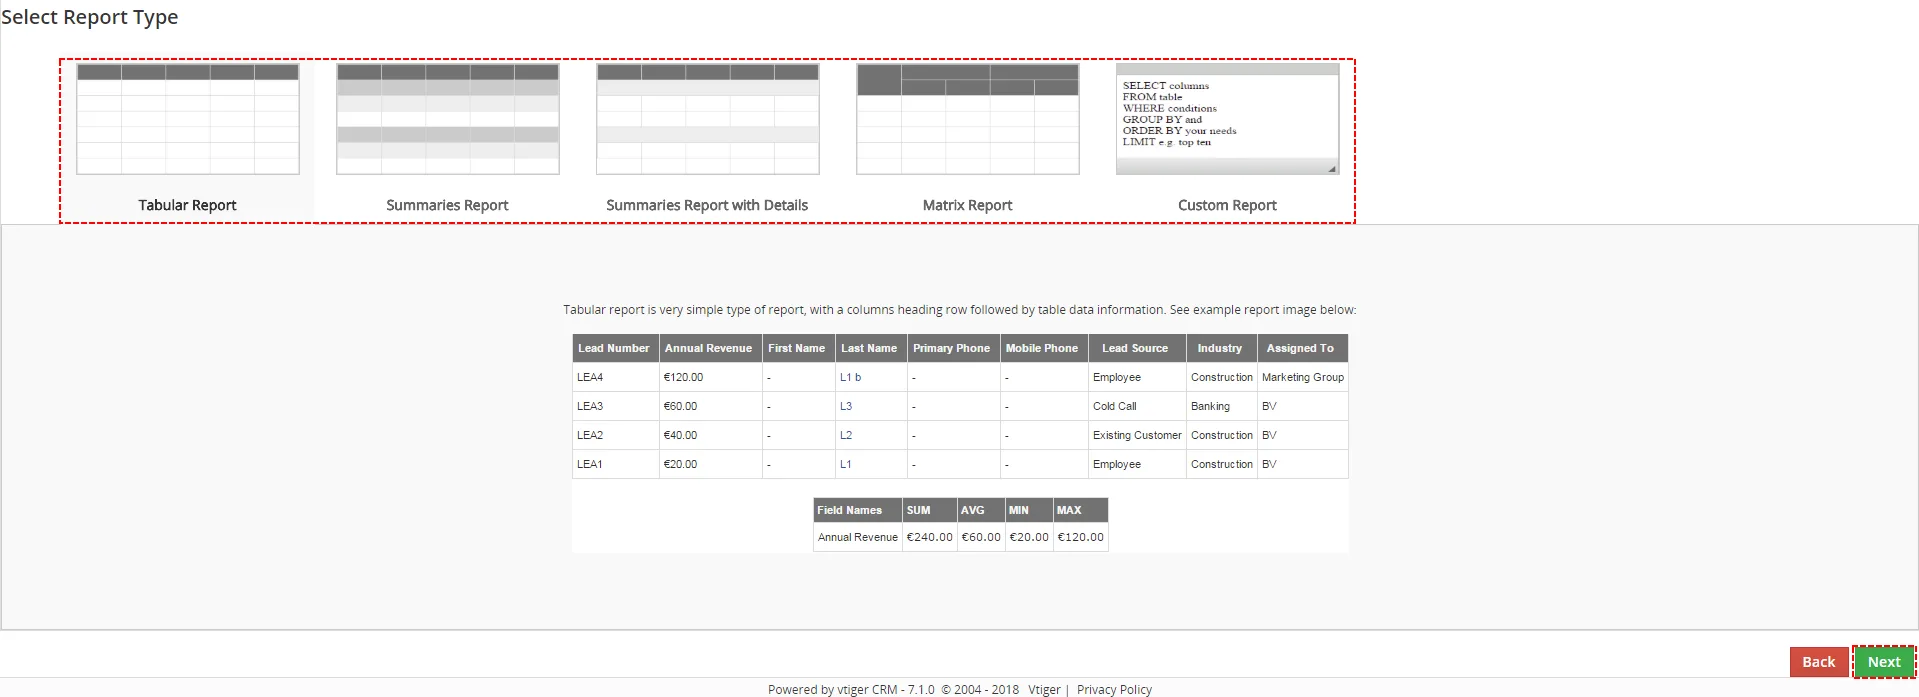
Tabular report is very simple type of report, with a columns heading row followed by table data information.
4.1.2 Summaries Report
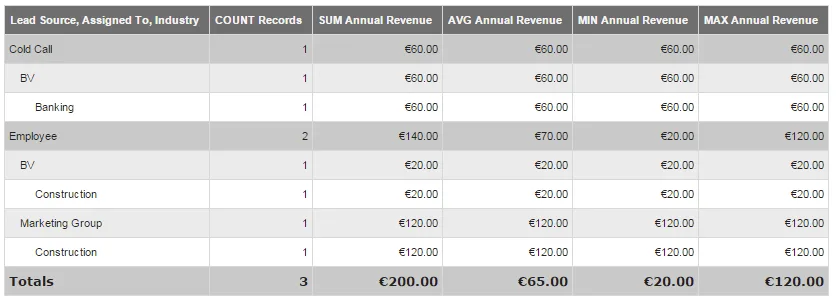
Summaries report is intended to use when performing data calculations grouped by selected columns. Group data choosing rows values by one row or combination (rows-rows), (rows-rows-rows).
Examples:
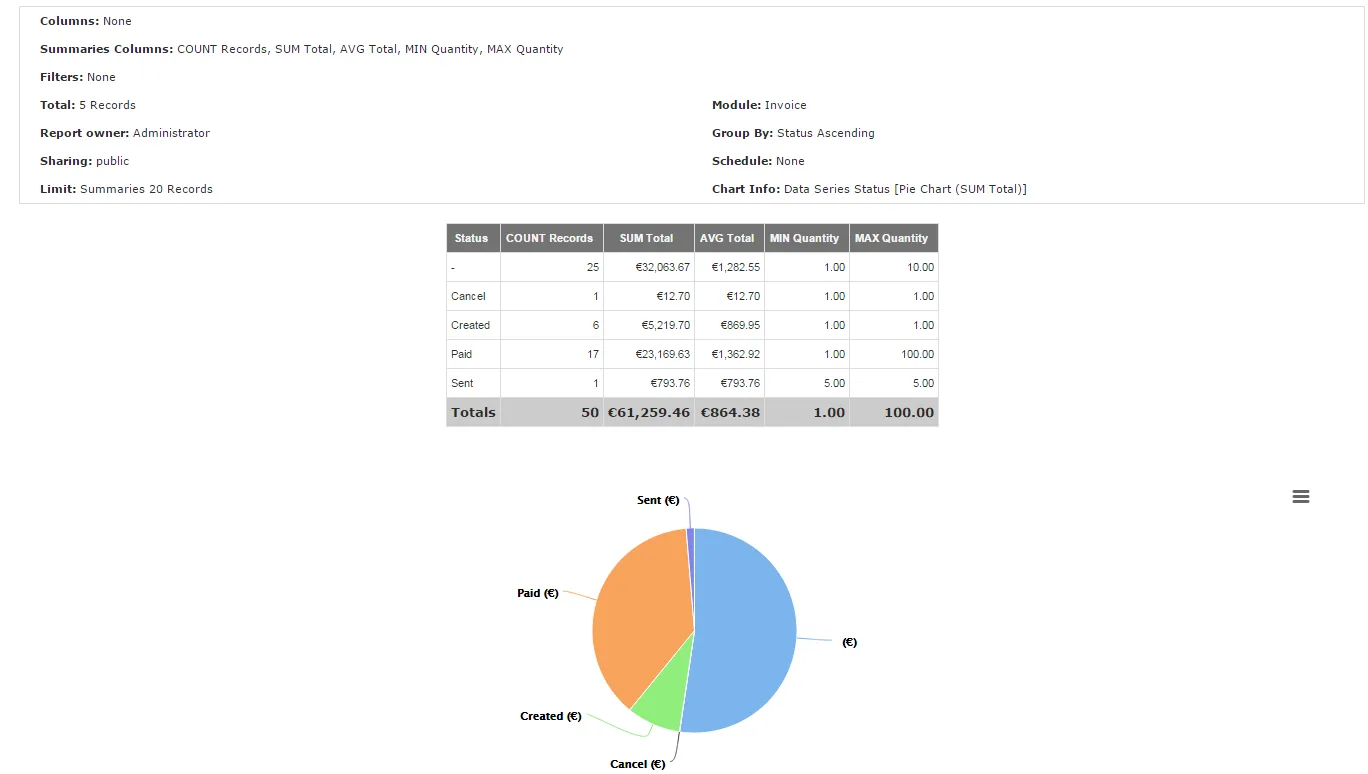
- Report grouped by one row (Invoice status). Summaries columns are COUNT Records, SUM Total, AVG Total, MIN Quantity, MAX Quantity. Filter is not set. Pie Chart (SUM Total).
Summaries Report grouped by one row – Reports 4 You Vtiger 7 - Report grouped by two rows (Invoice status, Customer No.). Summaries columns are COUNT Records, SUM Total, AVG Total, MIN Quantity, MAX Quantity. Filter is not set. Horizontal Chart (SUM Total).
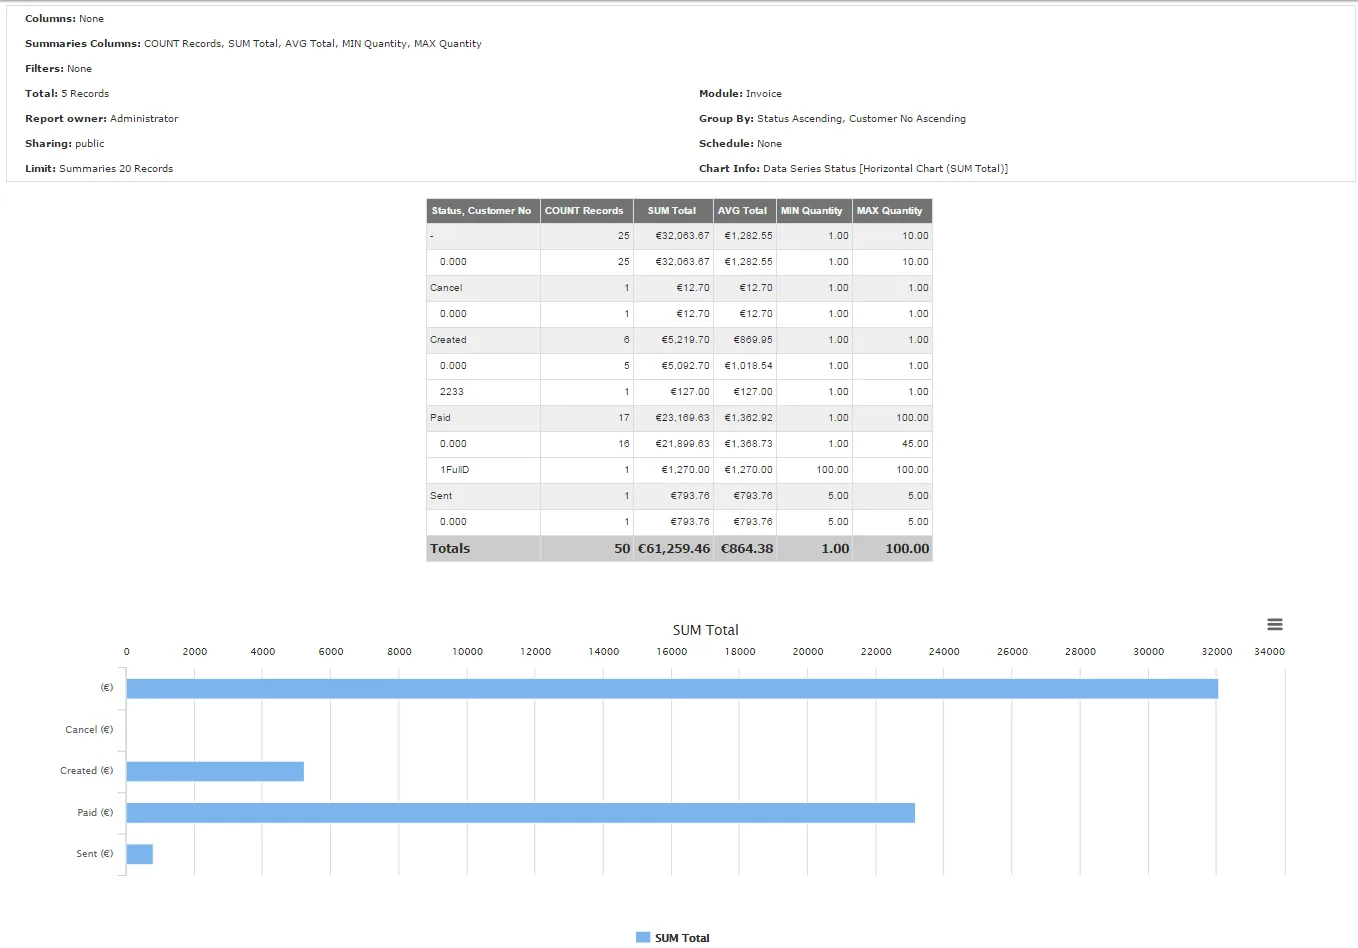
Summaries Report grouped by two rows – Reports 4 You Vtiger 7 - Report grouped by three rows (Invoice status, Contact Name, Invoice Date). Summaries columns are COUNT Records, SUM Total, AVG Total, MIN Quantity, MAX Quantity. Filter is not set. No Chart.
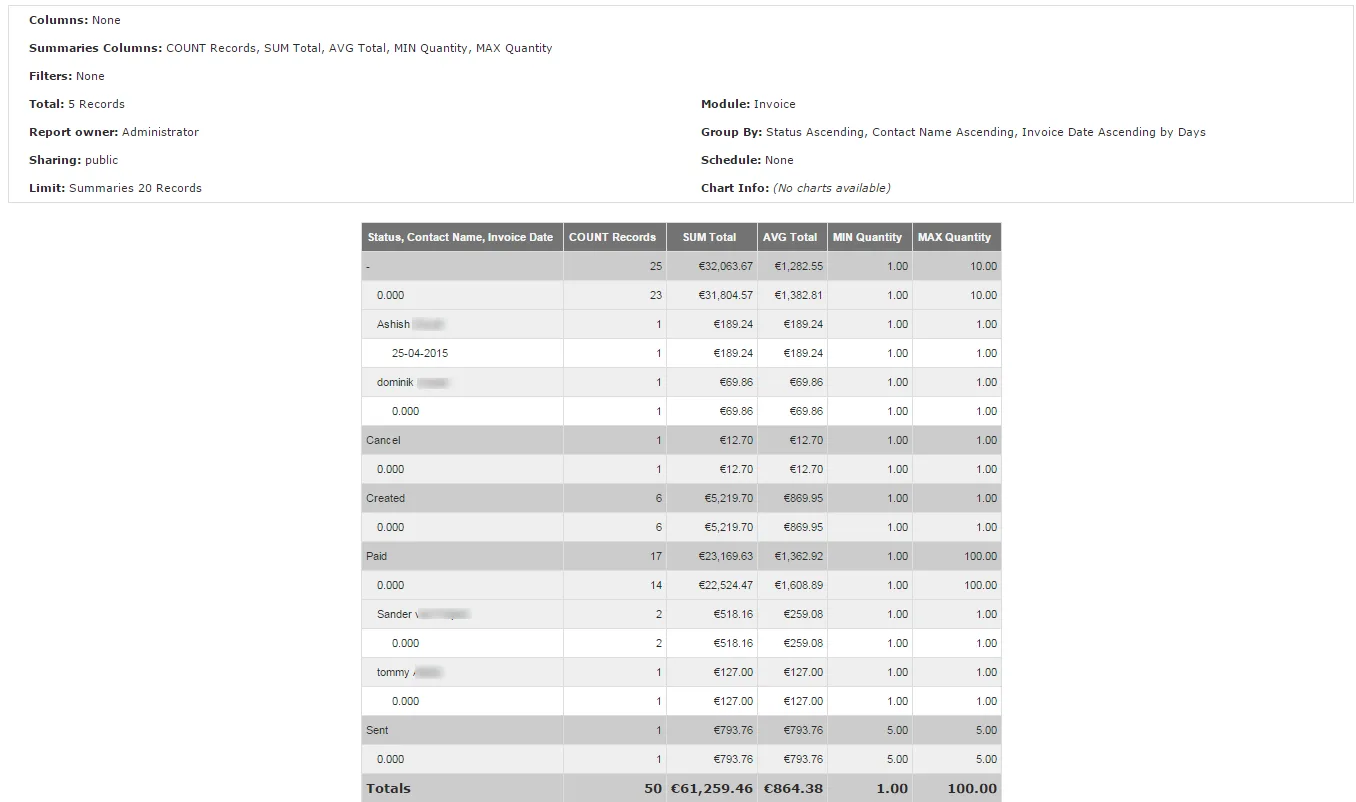
Summaries Report grouped by three row – Reports 4 You Vtiger 7
4.1.3 Summaries Report with Details
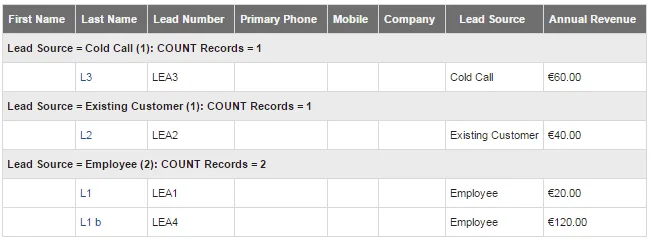
Summaries report with Details is intended to use when performing data calculations grouped by one selected column with displayed record details. You can define calculations for all report datas and define limited/unlimited count of displayed record details.
Example:
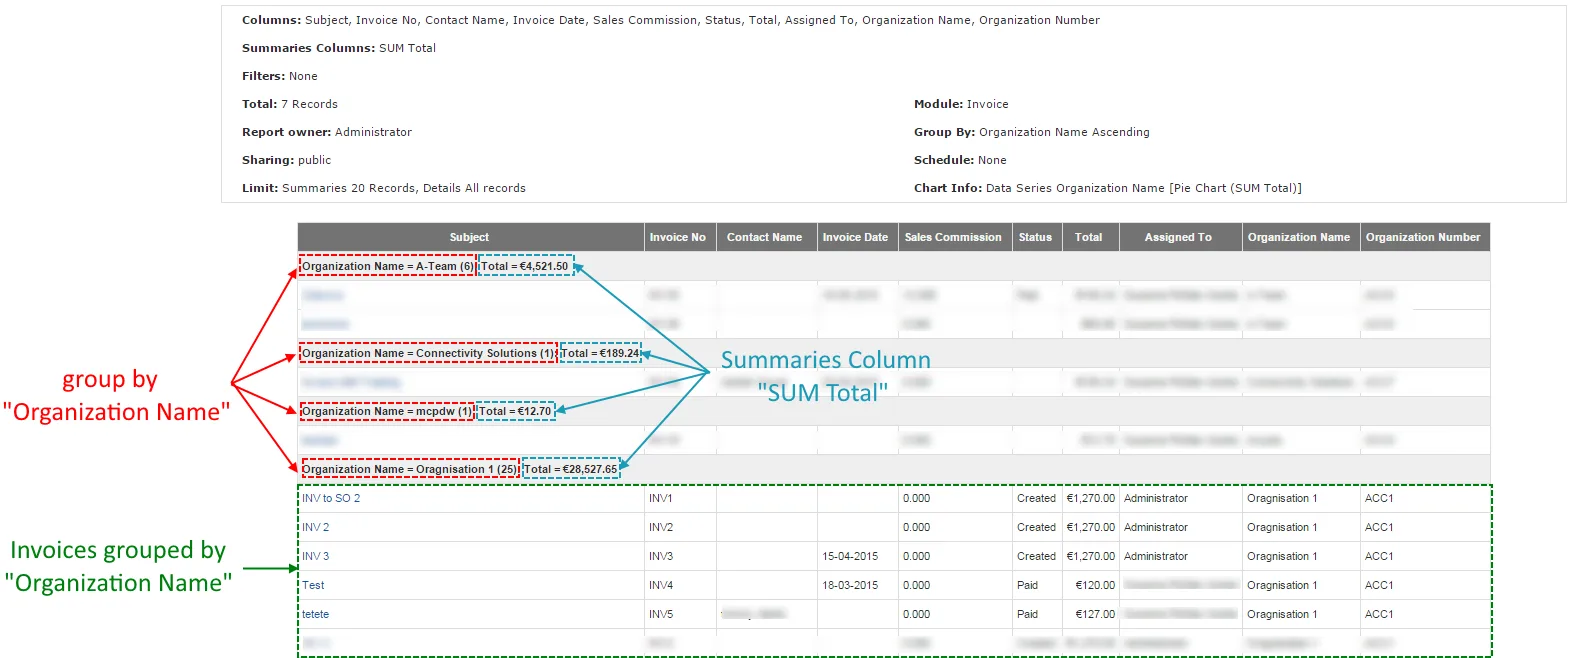
There is Report with details from Invoice module that is group by: Organization Name. Summaries Column is SUM Total. With Columns: Subject, Invoice No, Contact Name, Invoice Date, Sales Commission, Status, Total, Assigned To, Organization Name, Organization No.. Also Chart is included.
4.1.4 Matrix Report
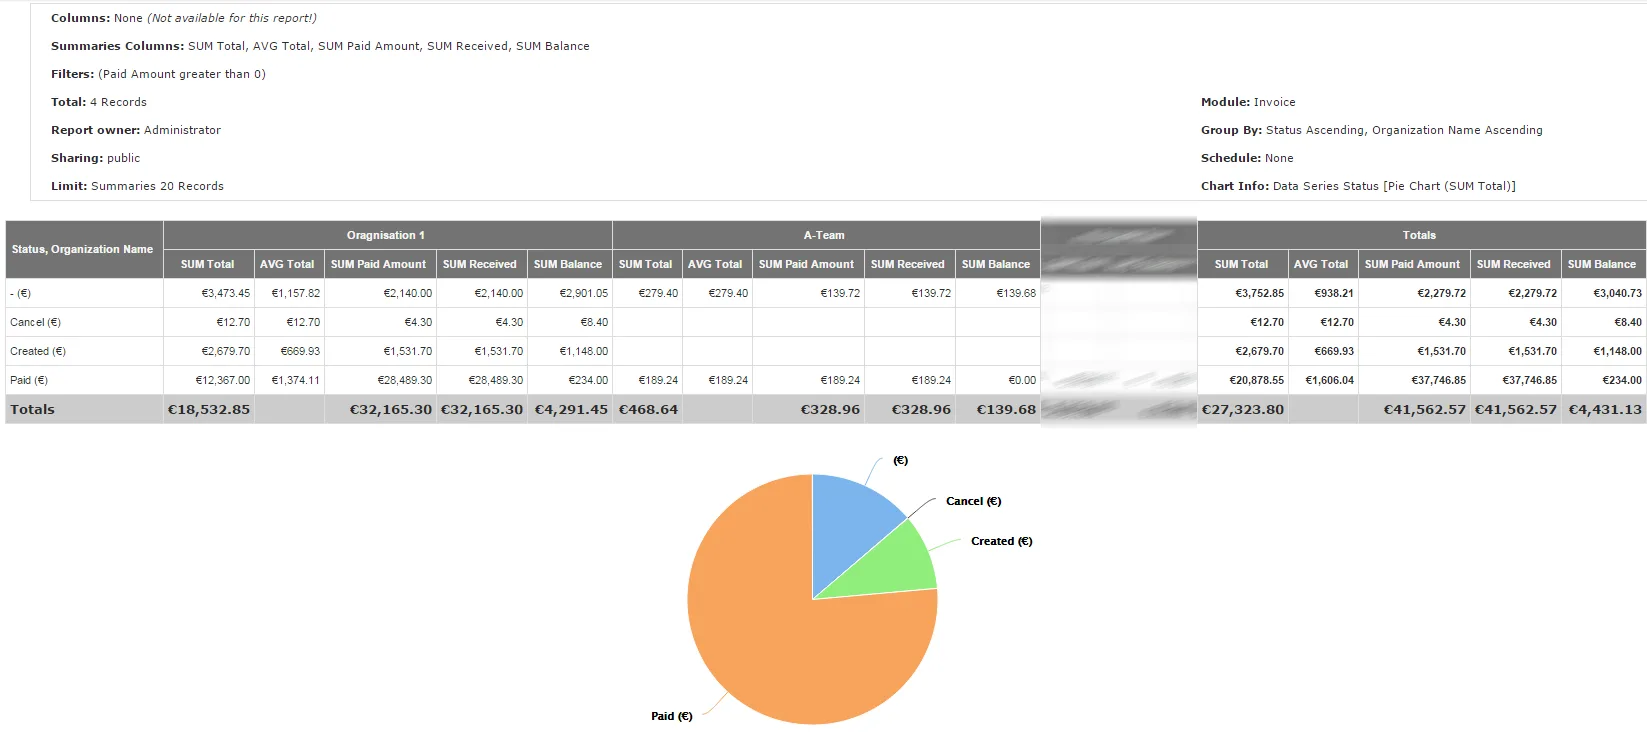
Matrix report is a summaries report with one group column displayed in columns structure. For example COUNT, SUM, AVG, MIN, MAX columns summaries calculated and displayed by date intervals, status, or other column values.

Example:
Report is grouped by row: Status and column: Organization Name. With filter: Paid Amount is greater than 0.
4.1.5 Custom Report
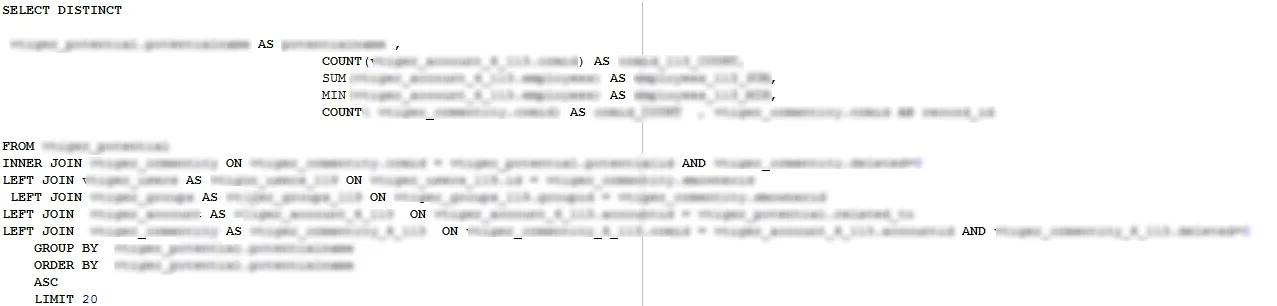
Custom report have to be programmed by skilled user with programming experiences. Do not forget that custom SQL Report display Records based on defined SQL query. Keep in your mind to use user permissions queries and share with permitted users only! Take care to be really careful with custom report SQL definitions.
4.2 Create the simple Report
In the following part you can see how to create simple Report.
- Open Reports 4 You ListView
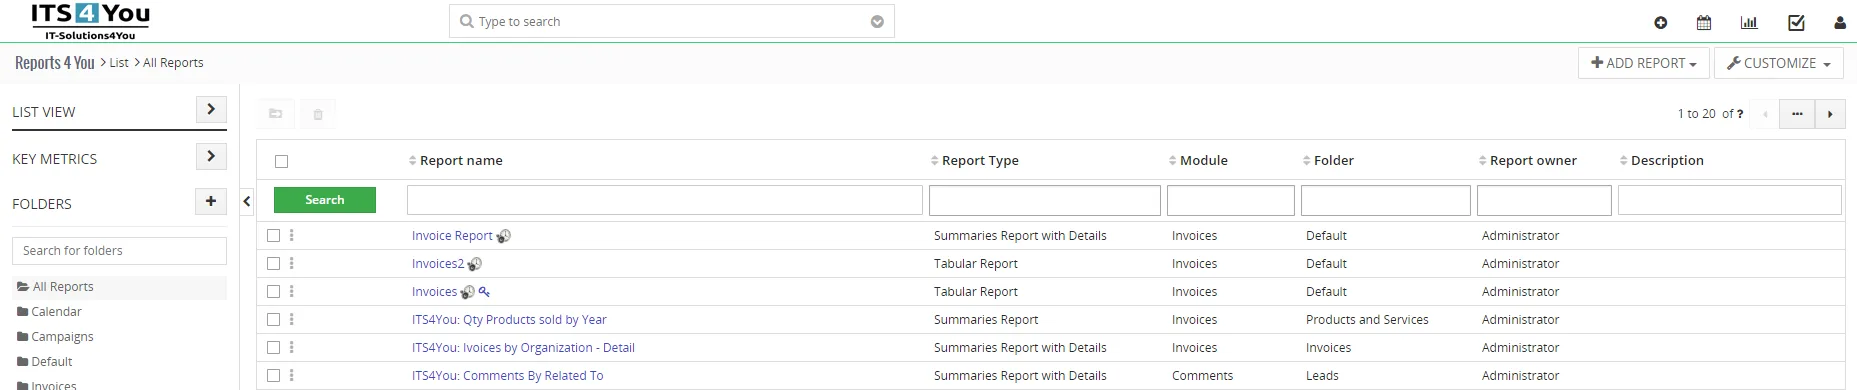
Create simple Report – Reports 4 You Vtiger 7 - Click on button
 and select your Report type or choose Select type view
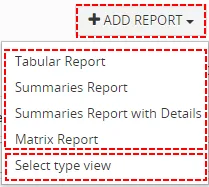
Create simple Report – Reports 4 You Vtiger 7 - If you choose Select type viewyou can see types with short description. About Report types you can read more: Types of Reports.
Choose Type of Report and click on button.
Create simple Report – Reports 4 You Vtiger 7 - Fill name and select primary module and also you can select Folder
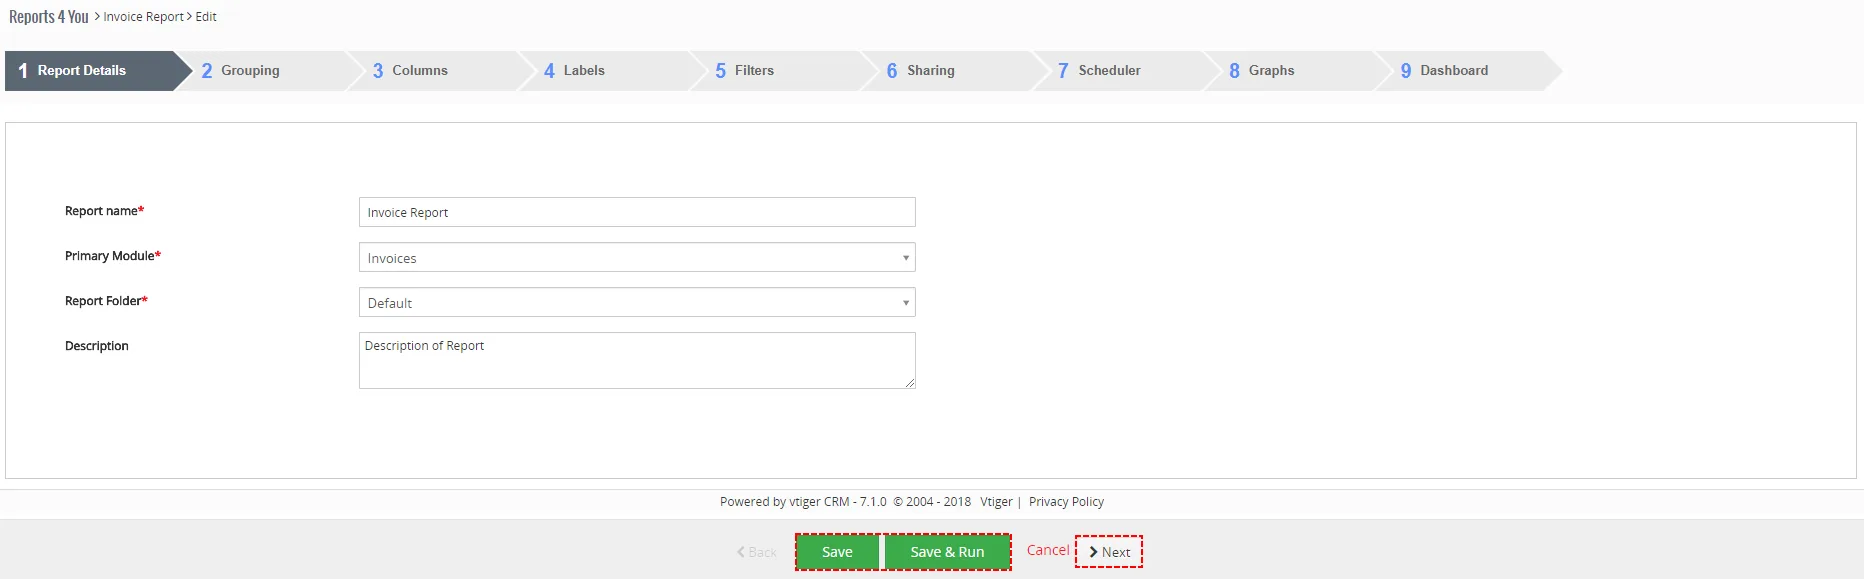
Create simple Report – Reports 4 You Vtiger 7 You have 2 options to pass through Reports 4 You creation:
- With
 button you pass through all possible tabs
- If you use
 or button, immediately when all required info are filled Report is generated (tabs that are not necessary are skipped)
- With
- You can group, select Summaries field and limit and sort
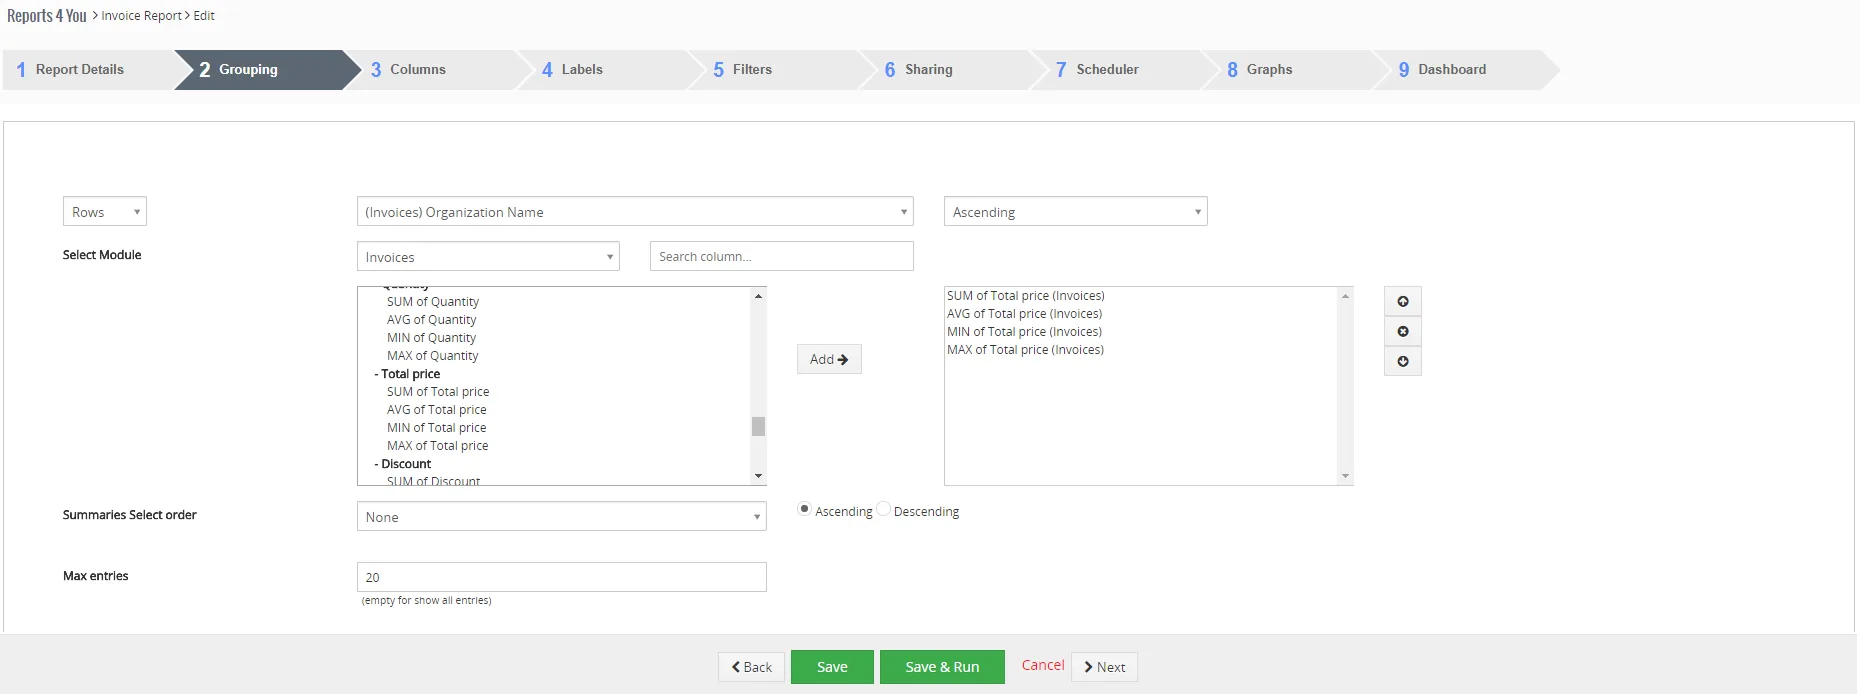
Create simple Report – Reports 4 You Vtiger 7 - Select fields to display in Report
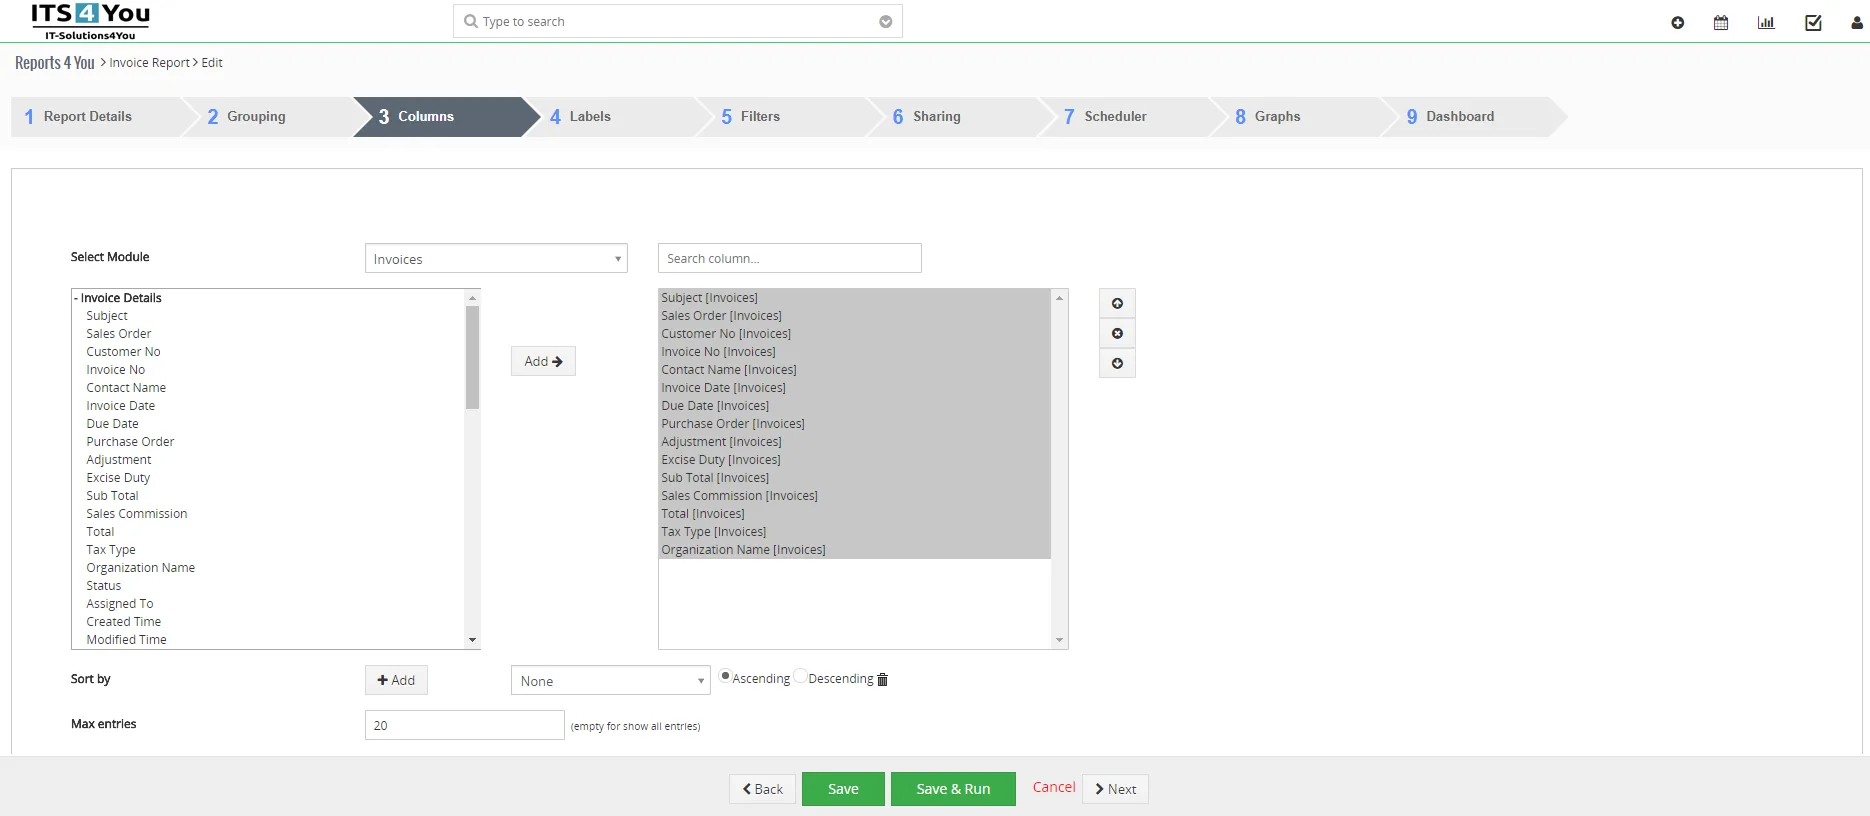
Create simple Report – Reports 4 You Vtiger 7 - You can edit Labels shown in Report
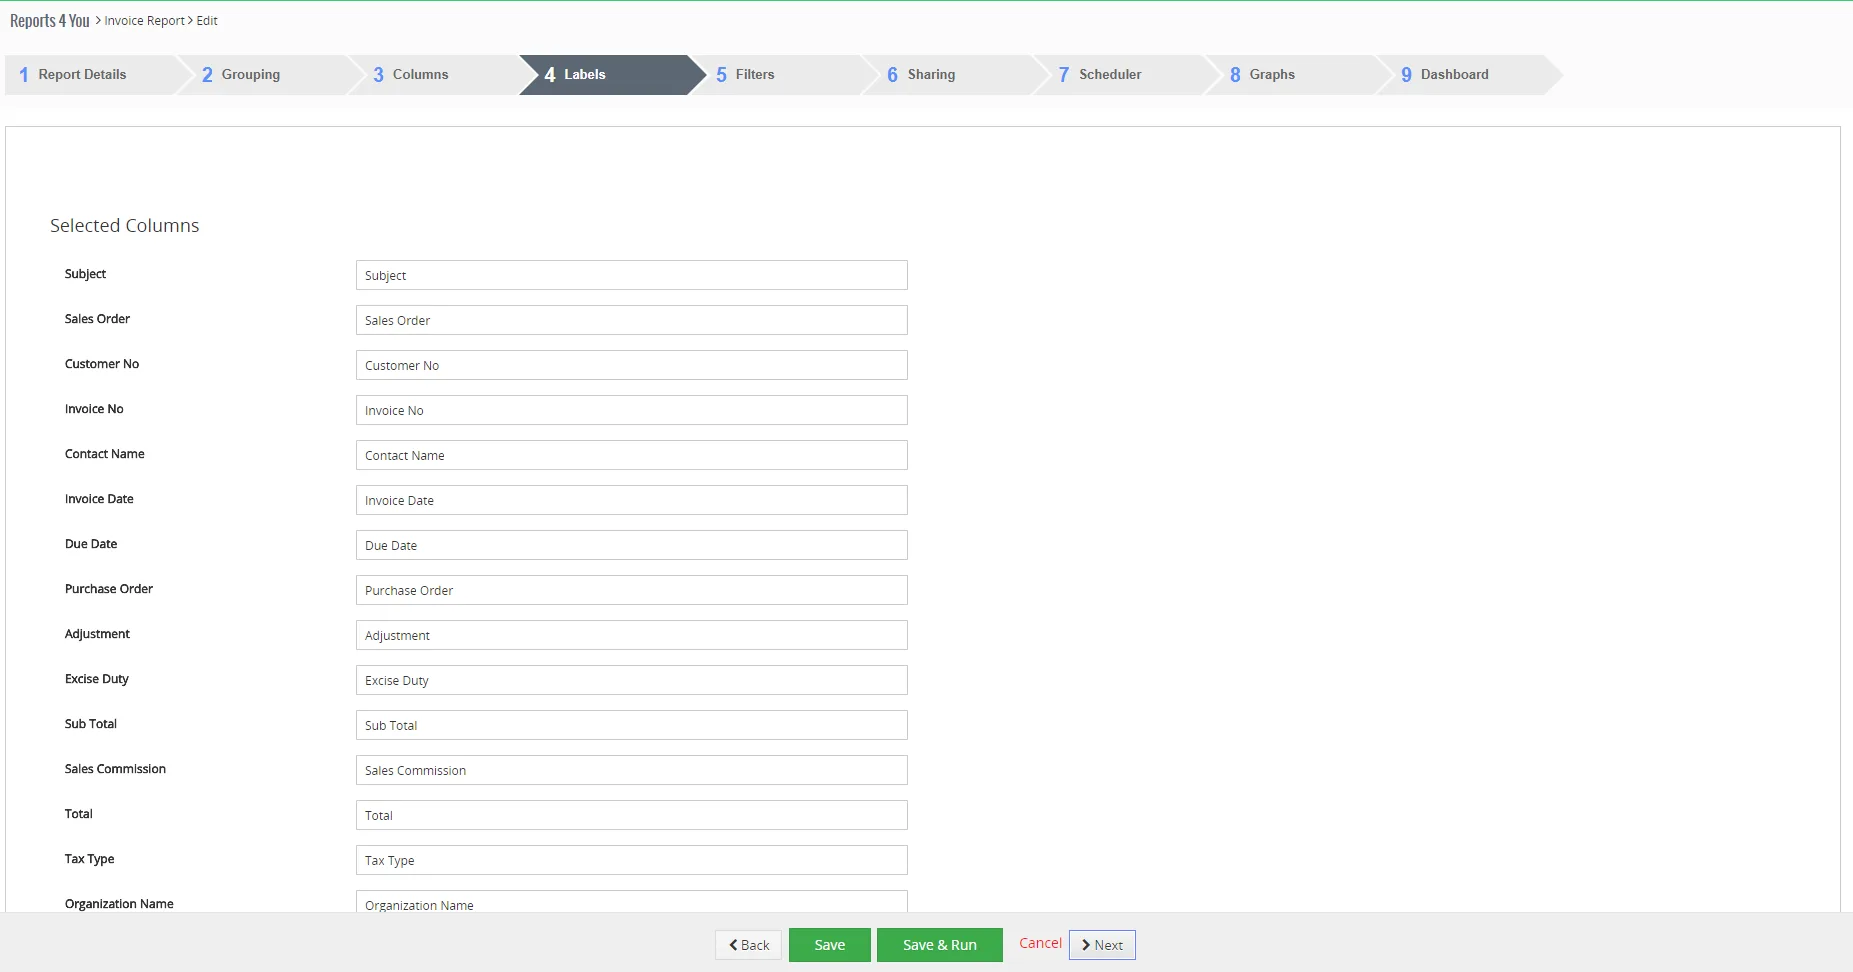
Create simple Report – Reports 4 You Vtiger 7 - You can use filters
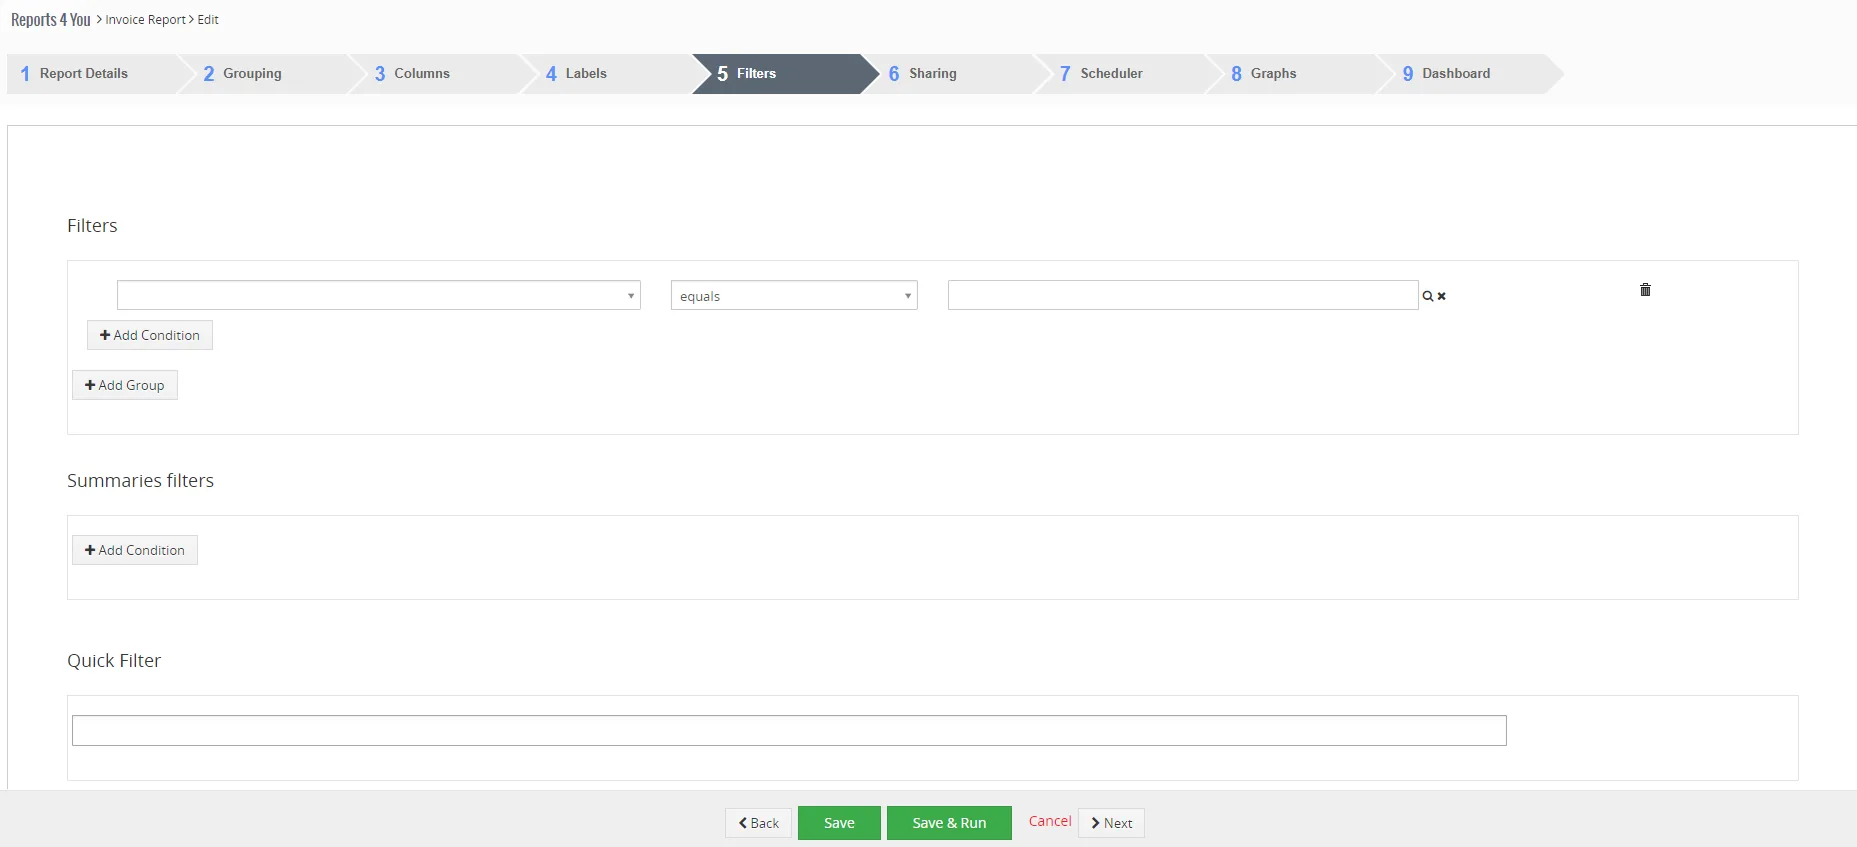
Create simple Report – Reports 4 You Vtiger 7 - Define sharing
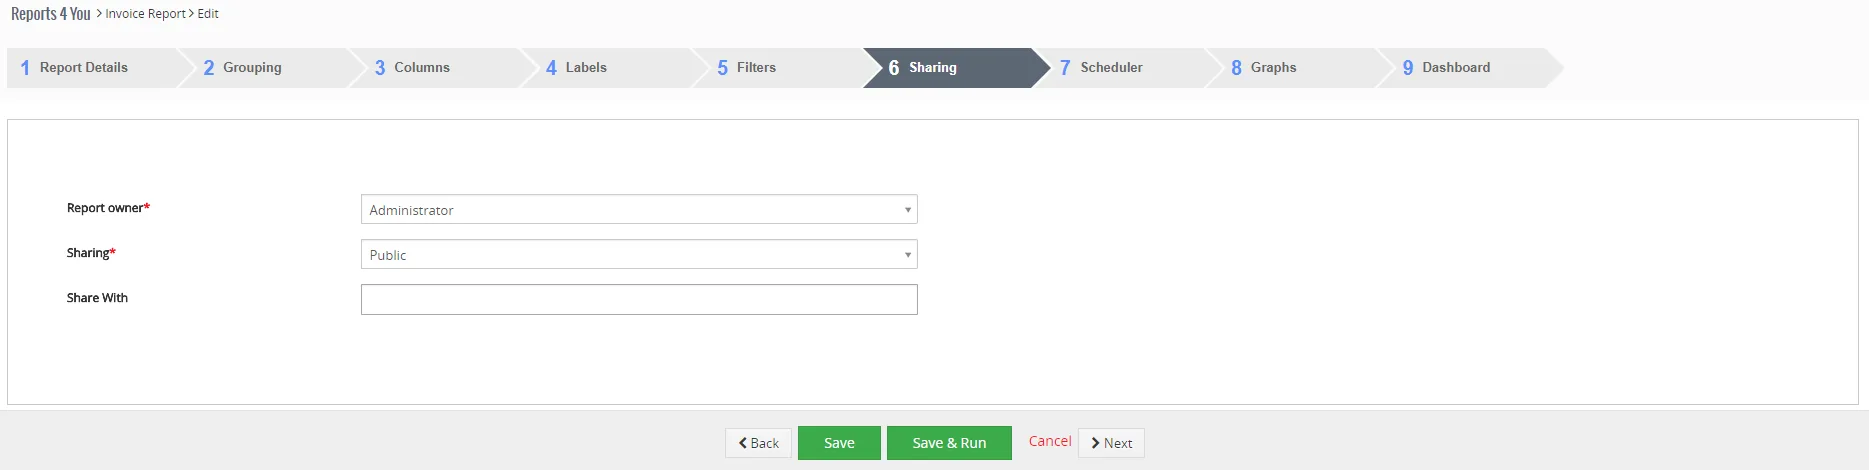
Create simple Report – Reports 4 You Vtiger 7 - You can turn on scheduling
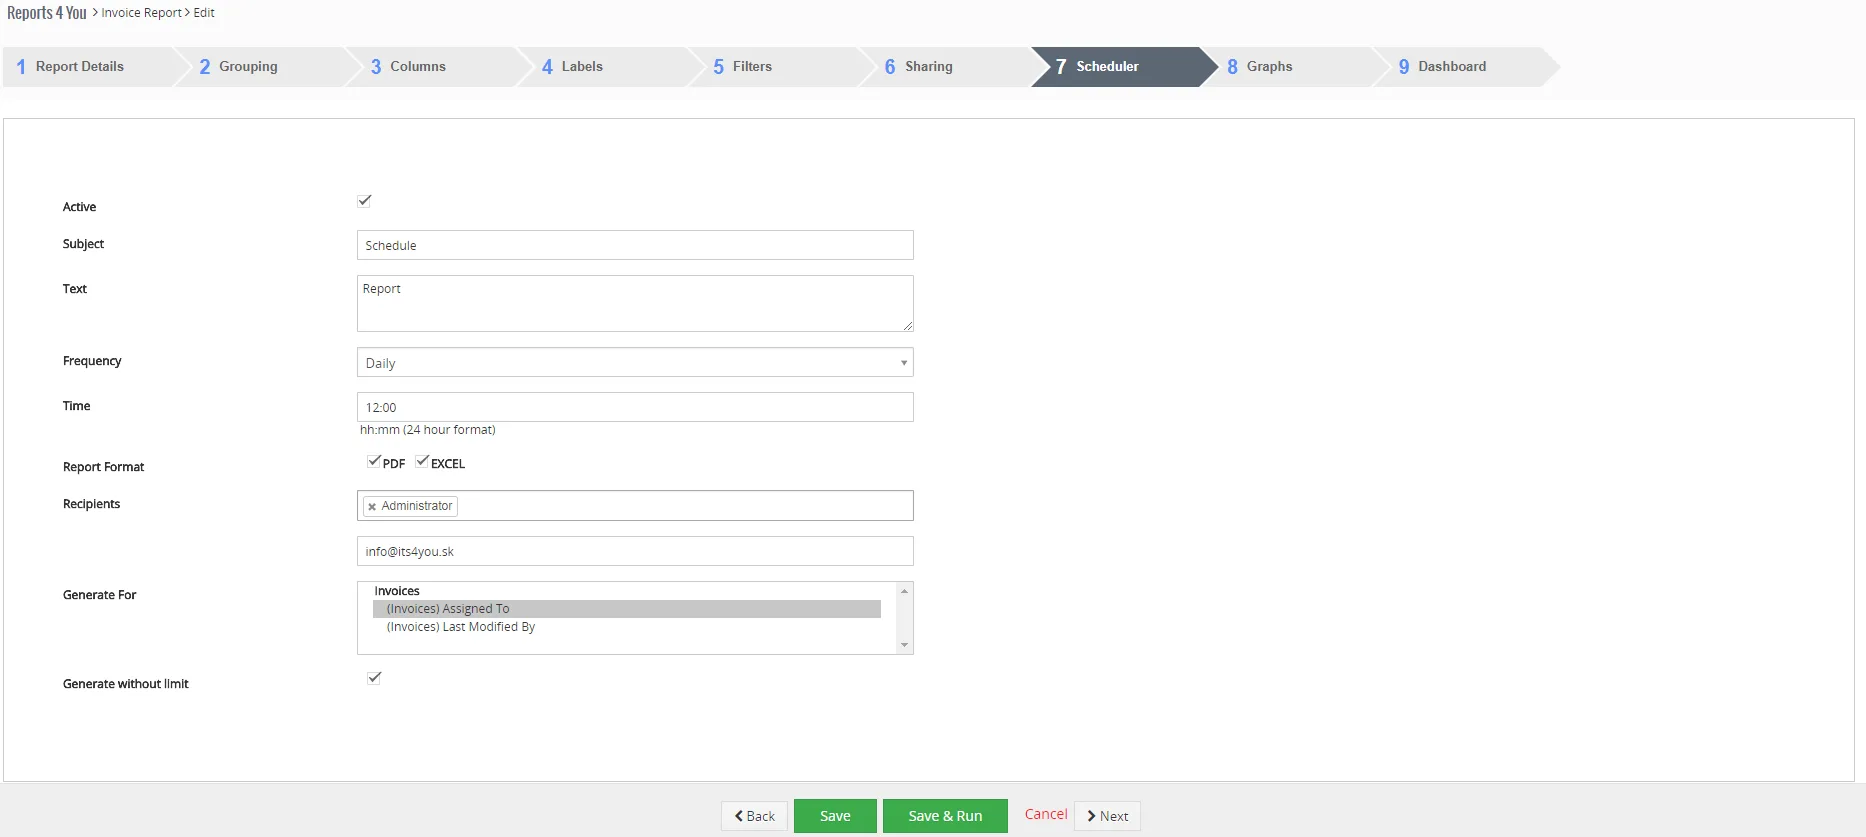
Create simple Report – Reports 4 You Vtiger 7 - If you want to show Graphs you can set it in this tab
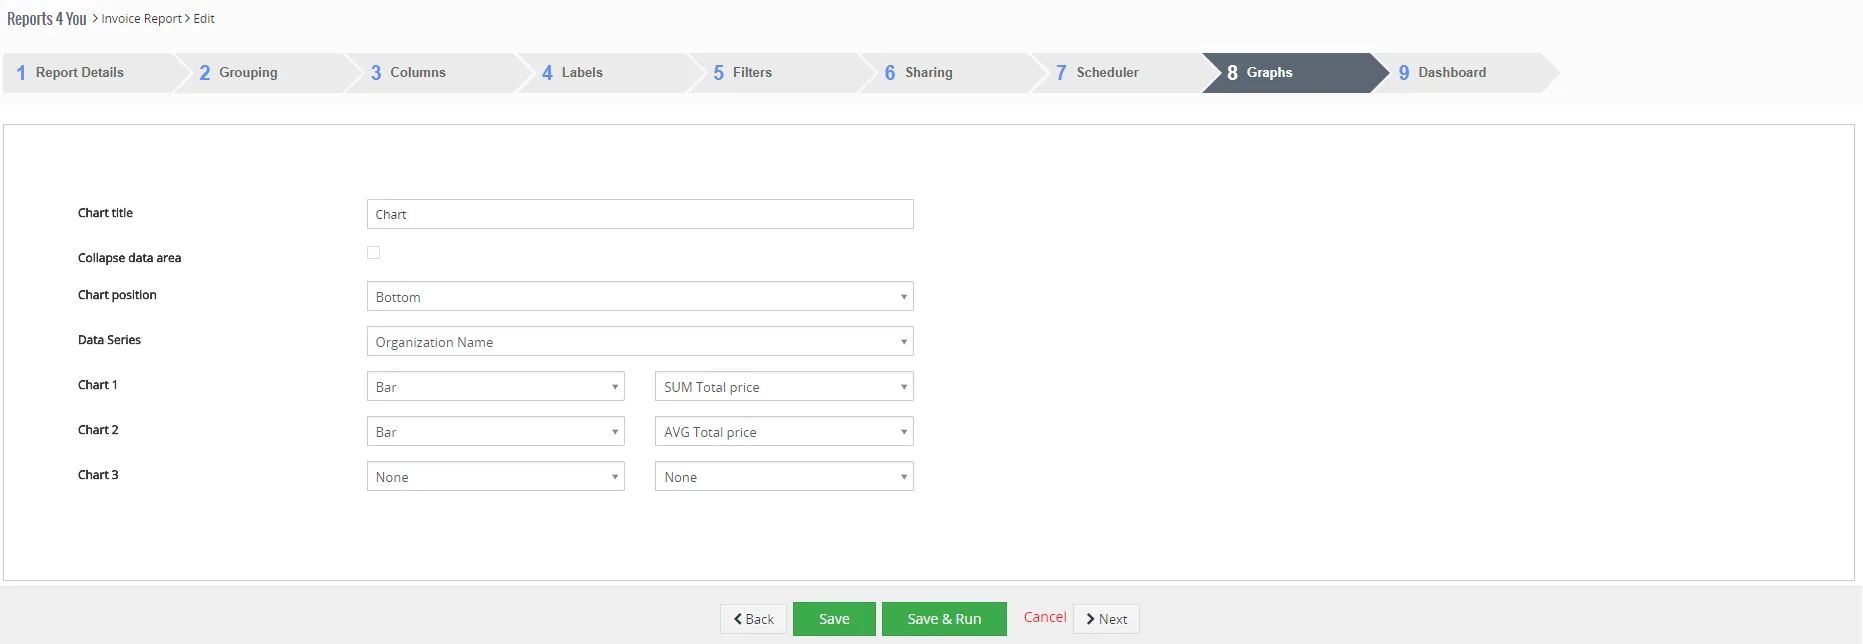
Create simple Report – Reports 4 You Vtiger 7 - In the last step you can create Widget on your Dashboard.
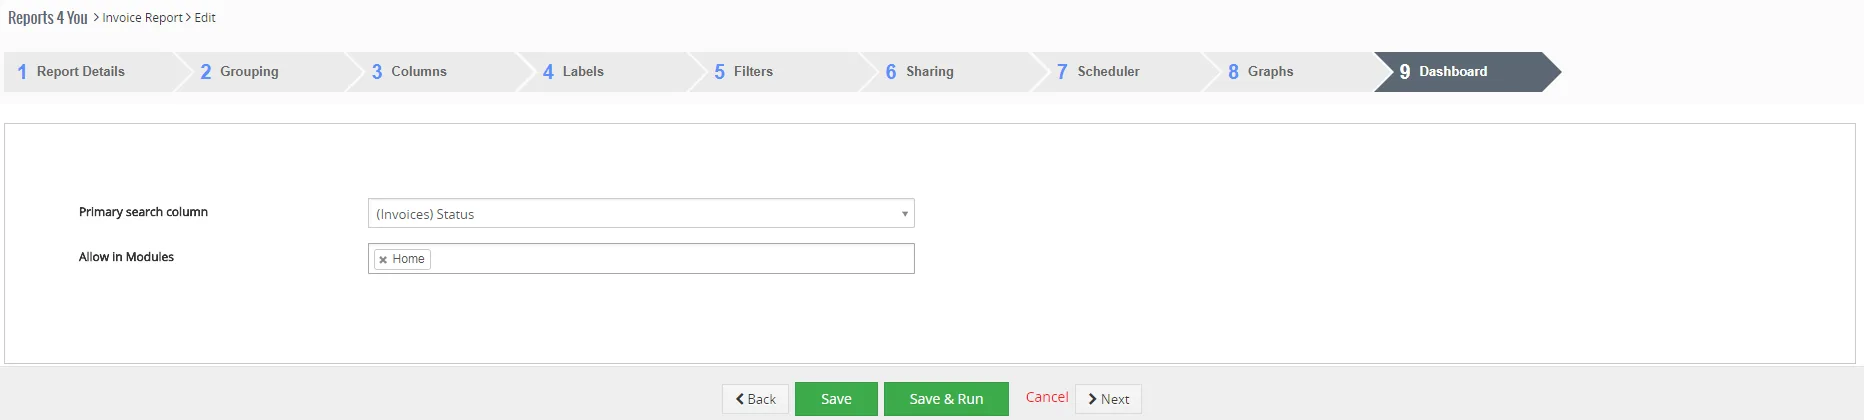
Create simple Report – Reports 4 You Vtiger 7
Then please click on or
Need help with Reports 4 You?
Our support team answers questions about installation, templates and settings.