
Reports for Vtiger CRM
Build advanced CRM reports, dashboard metrics and visual charts from your Vtiger data. Use filters, summaries, scheduled delivery and multiple report types in one reporting extension.
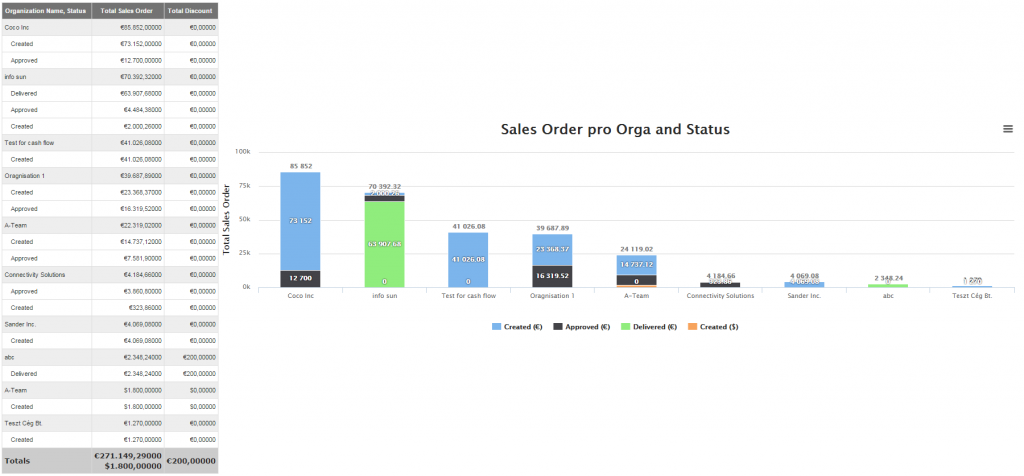
Sales performance report
Filtered CRM data with charts and metricsReports Vtiger Features
Reports helps you create more useful business reports from your Vtiger CRM data. You can prepare tabular reports, summaries, charts, filtered reports and scheduled exports.
- Create multiple types of reports
- Use key metrics on dashboards
- Limit and sort report results
- Rename reported fields with custom labels
- Use advanced filters and summaries filters
- Schedule reports by email
- Generate interactive graphs and charts
- Use primary search column for dashboard filtering
Main Features of Reports
Instead of tabs, the main features are displayed as separate sections. This makes the page easier to read, easier to index and easier to extend with new screenshots later.
5 Types of Reports
Create tabular, summary, summary with details, matrix and custom reports.
Key Metrics
Use calculated report values on dashboards for quick business overview.
Limit and Sort
Show top records and sort results by selected fields.
Custom Labels
Rename report fields to make reports clearer for users.
Better Filtering
Use advanced filters, summaries filters and quick filters.
Scheduler
Send reports automatically by email at regular intervals.
Graphs
Generate multiple chart types including bar, column, line, pie and funnel charts.
Primary Search Column
Filter dashboard report widgets by primary search column.
Create 5 types of reports
Reports allows you to build different report structures depending on your business need. Choose a simple tabular report, a summary report, a summary report with details, a matrix report or a custom report for advanced Vtiger CRM reporting.
Click any report type image to open a larger preview.
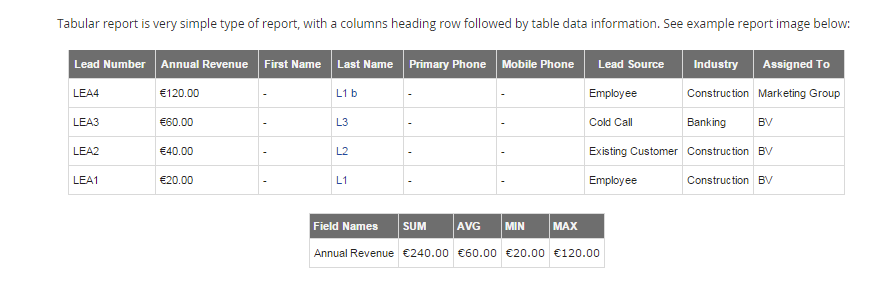
Tabular Report
Simple row based reports for clean CRM data lists.
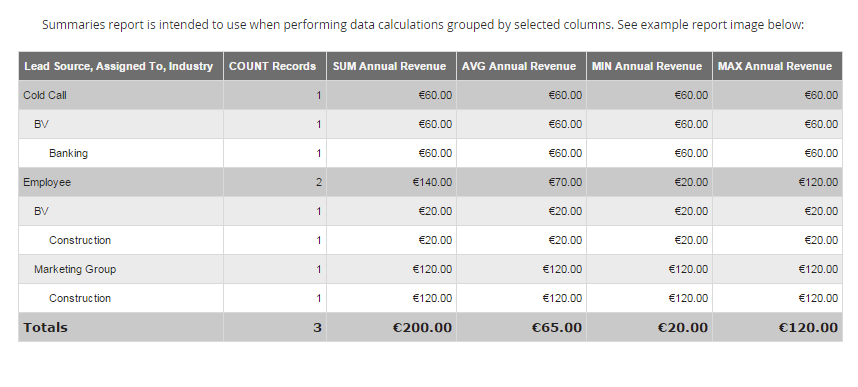
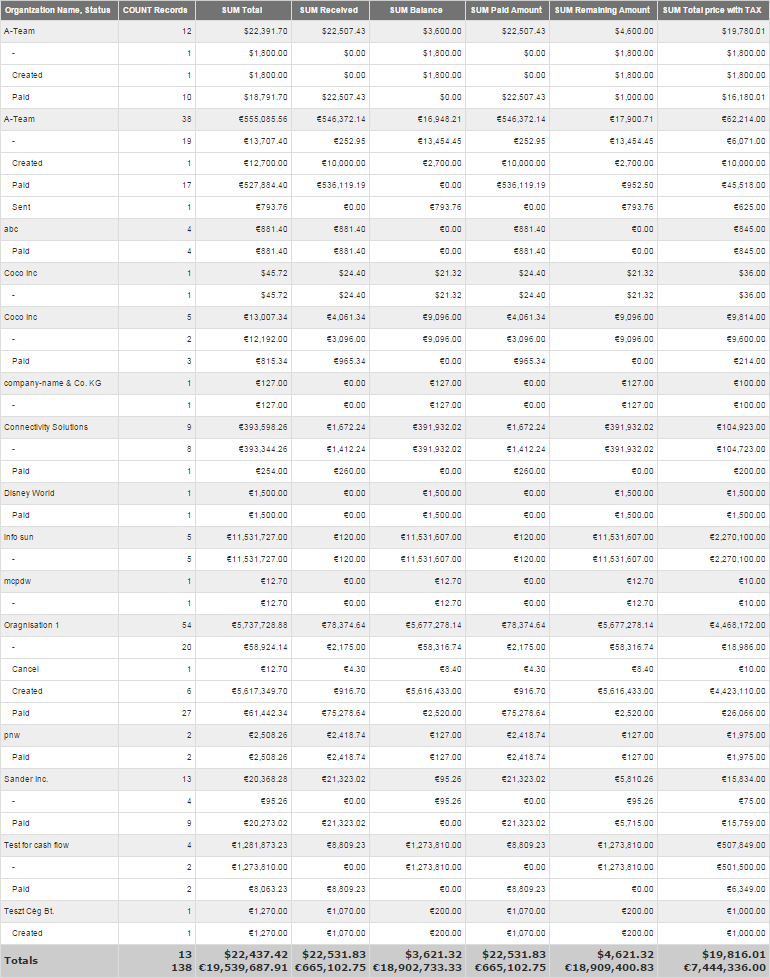
Summaries Report
Grouped reports with calculated summary values.
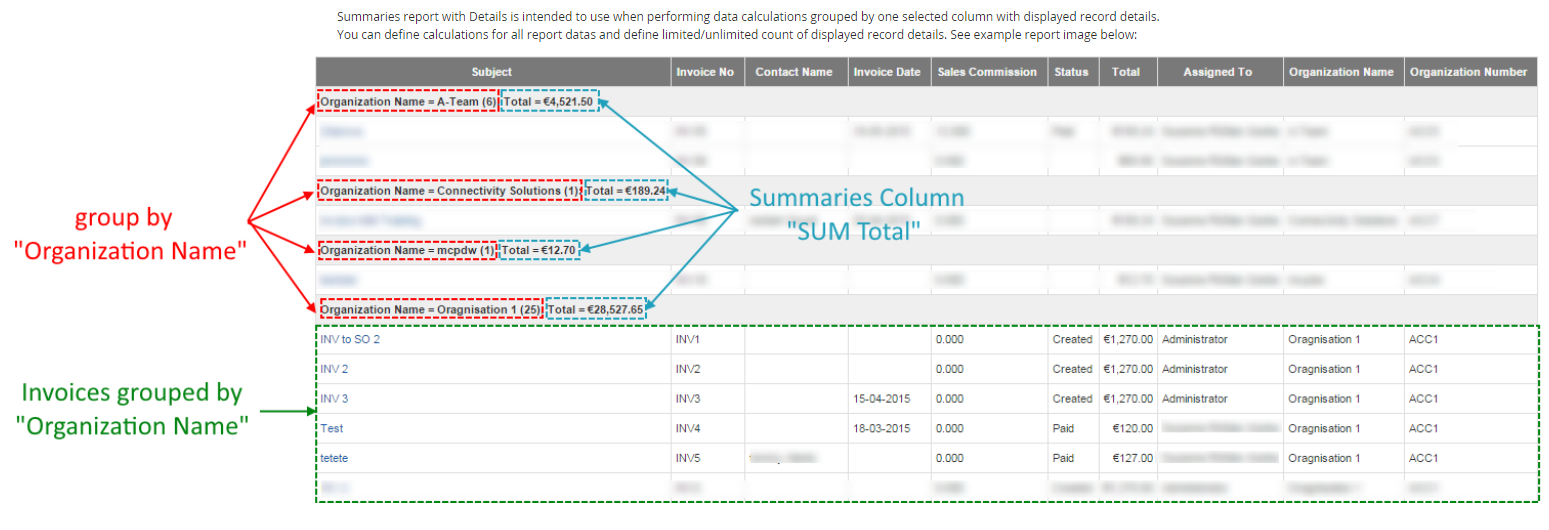
Summaries Report with Details
Summary values together with detailed record data.
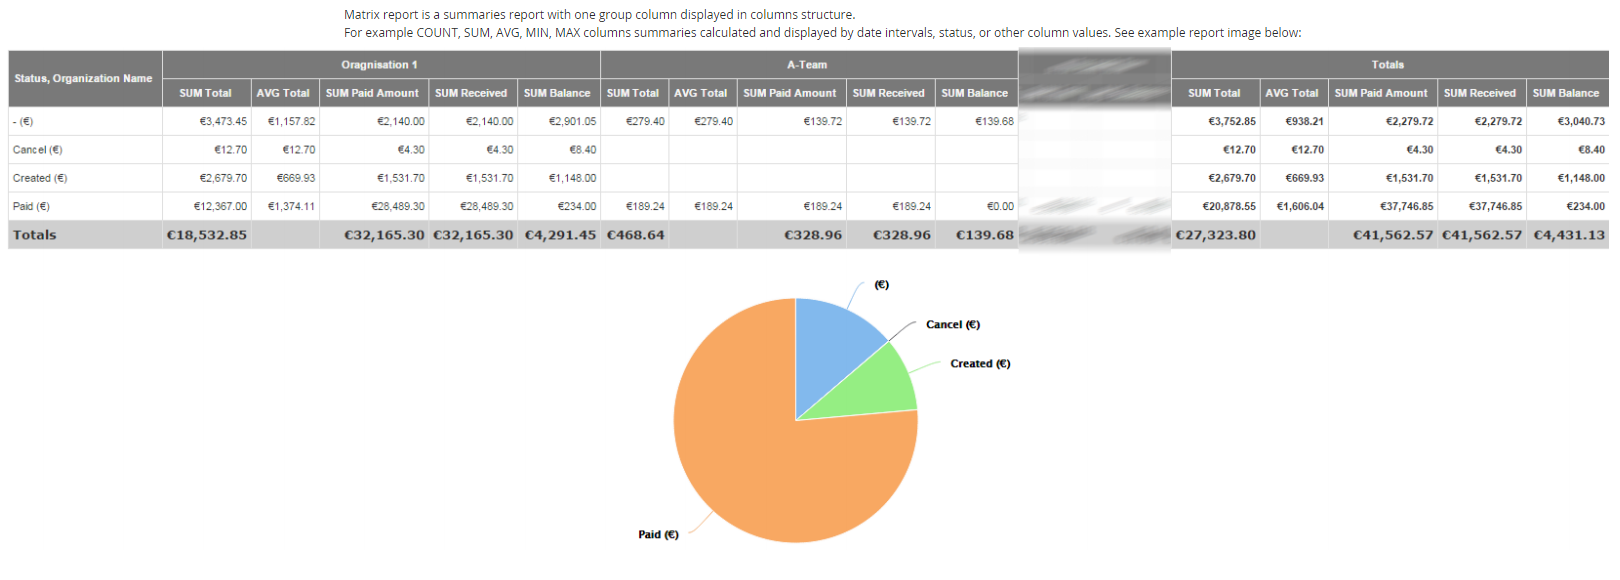
Matrix Report
Cross table reporting for comparing grouped CRM values.
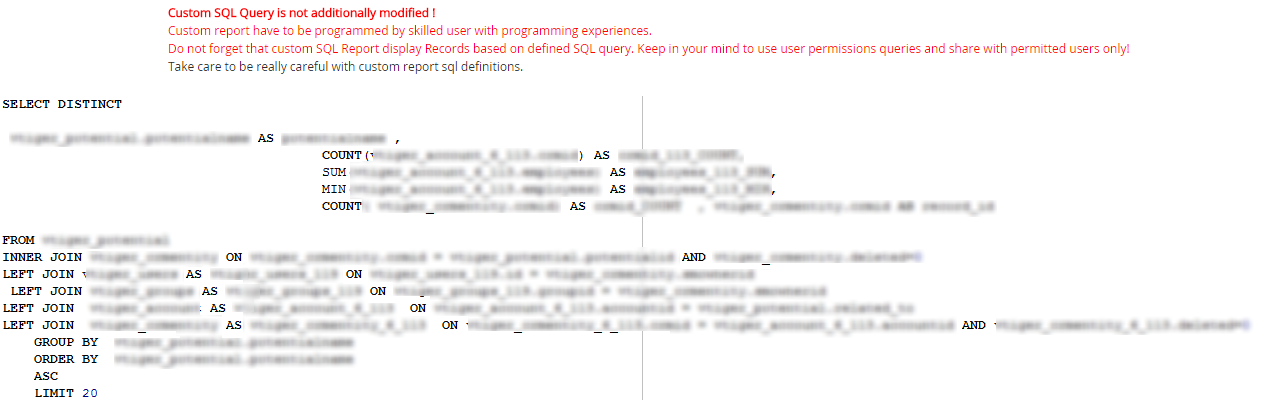
Custom Report
Advanced custom reports for specific reporting logic.
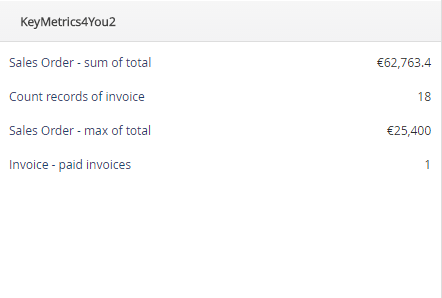
Key Metrics for dashboard reporting
Key Metrics allow you to create dashboard views with information like Count of records based on filters. After creating a Tabular Report, you can use metrics such as SUM, AVG, Min and Max on Dashboard.
- Display report values on Dashboard
- Use SUM, AVG, Min and Max values
- Track important CRM metrics faster
Limit and Sort order
Limit and Sort order helps you work with large reports. You can limit the number of shown records and sort them by selected fields in ascending or descending order.
- Show top records from selected report
- Sort by selected fields
- Useful for top sellers, largest opportunities or best performing organizations

Click the screenshot to open the full size image in a new tab.

Custom Labels for report fields
Standard Vtiger field names are useful, but report users often need clearer names. With Custom Labels, you can rename reported fields so your reports are easier to understand.
- Rename report field labels
- Improve report readability
- Make reports more understandable for end users
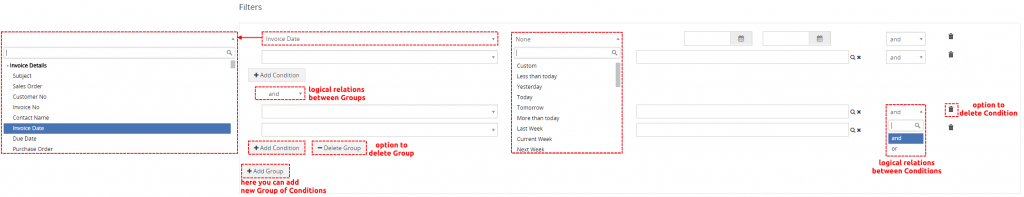
Better Filtering
Reports provides advanced conditions for filtering report results. You can use filters, summaries filters and quick filters to get more relevant report data.
- Create conditions in Filters and Summaries Filters
- Use fields from selected and related modules
- Use multiple comparators and conditions
- Use Quick Filter in report Detail View
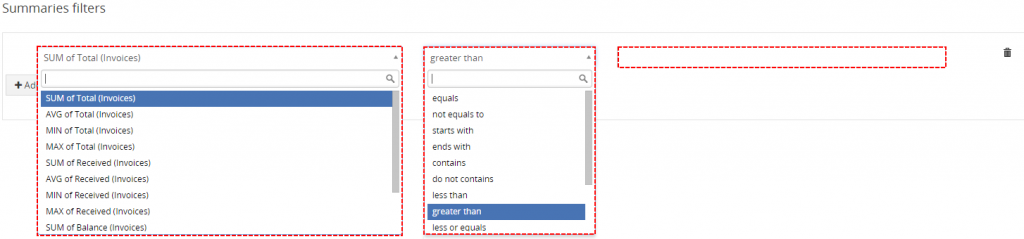
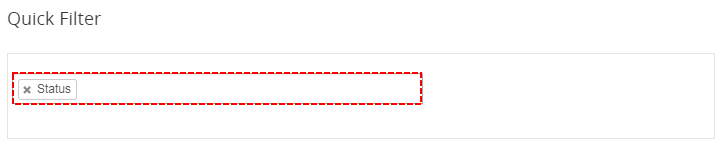
Click the screenshot to open the full size image in a new tab.
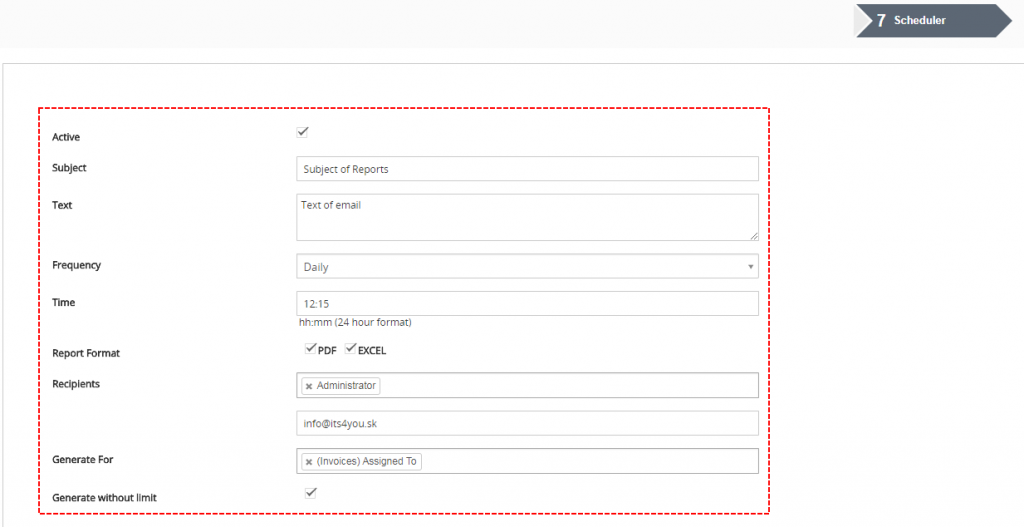
Scheduler
Scheduler allows you to send reports at regular intervals to selected users by email without logging into CRM. You can export reports as PDF, Excel or both.
- Send reports automatically by email
- Schedule report delivery
- Export reports as PDF or Excel
- Use workflow scheduler if scheduler is not active
Graphs and charts
Reports supports multiple chart types, so users can visualize report results and understand CRM data faster. This section is intentionally full width because every graph type needs enough space for a clear screenshot and a useful preview.
Click any chart image to open a larger preview.
Bar chart
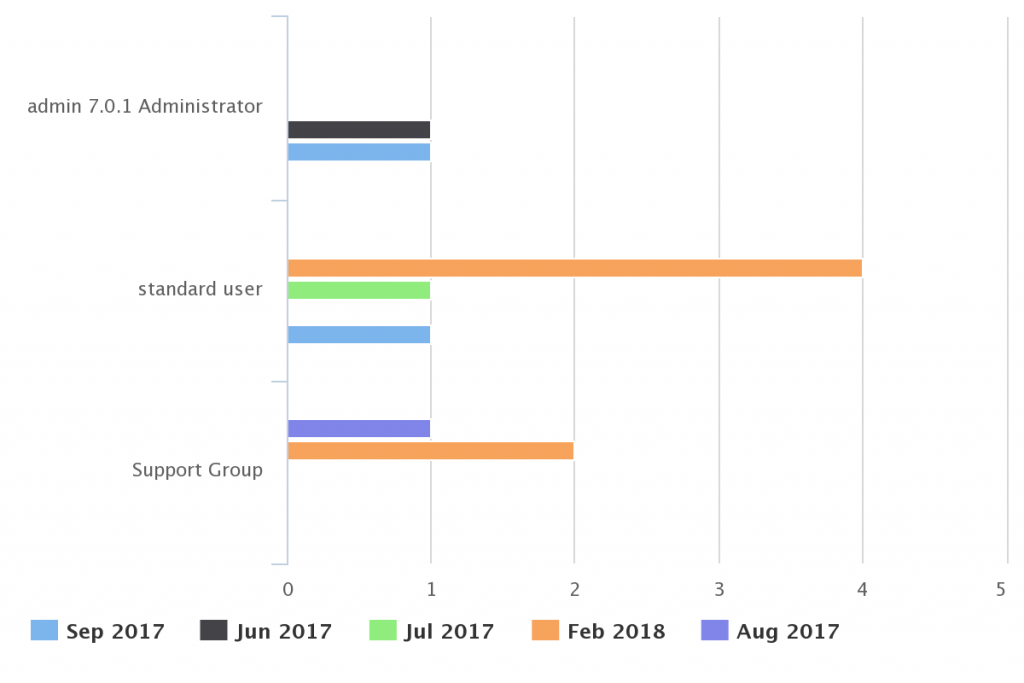
Stacked bar chart
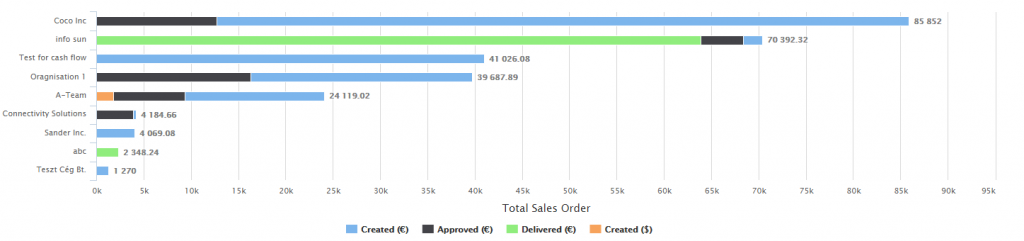
Column chart
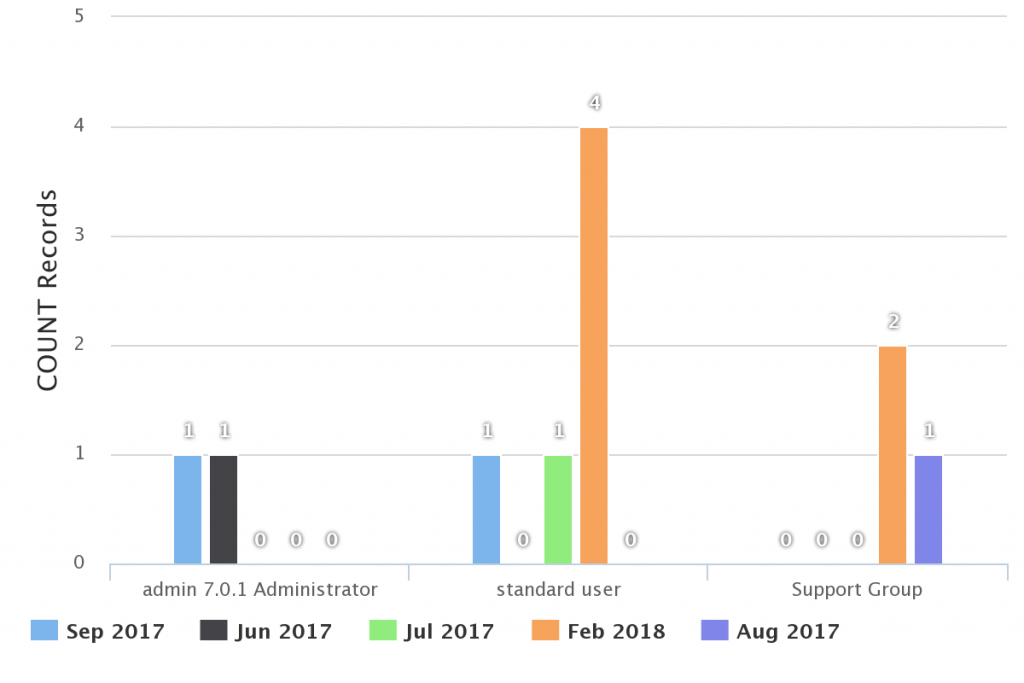
Stacked column chart
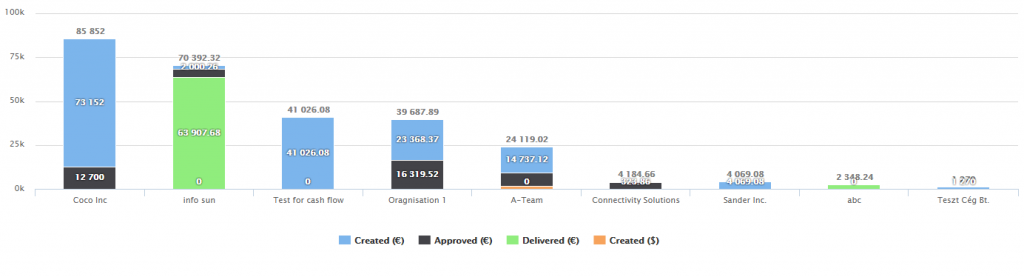
Line chart
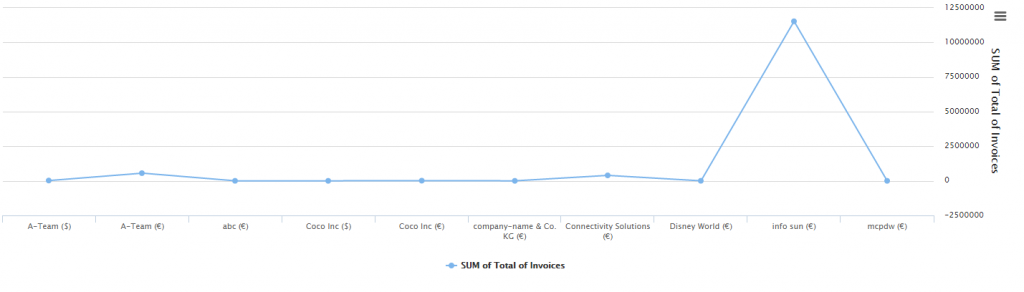
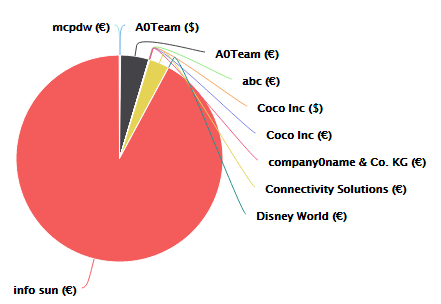
Pie chart
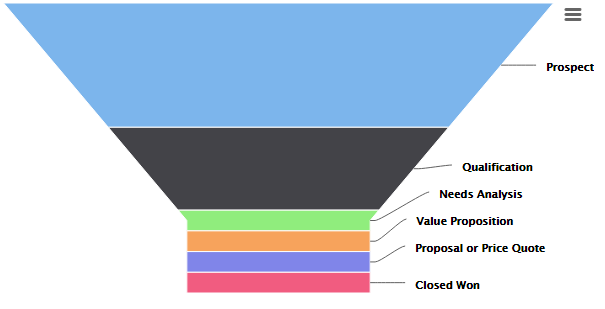
Funnel chart

Primary Search Column
Primary Search Column allows dashboard widgets to be filtered by the selected column. This helps users quickly narrow report results directly from the dashboard.
- Filter dashboard report widgets
- Use selected primary column
- Improve report interaction from dashboard views
Turn CRM data into visual reports
Reports can help you answer business questions such as how many Sales Orders are related to an organization, which opportunities perform best or how values change over time.
- Analyze CRM data from multiple modules
- Create report charts for better overview
- Use filters and summaries to focus on important data
Available as a single extension or inside Vtiger extension packages
You can purchase Reports as a standalone Vtiger extension, or get it as part of our Vtiger extension packages together with other useful tools for your CRM.
Reports FAQ
Short answers for users comparing Vtiger CRM reporting options and deciding whether Reports fits their CRM reporting workflow.
What is Reports for Vtiger CRM?
Reports is a reporting extension for Vtiger CRM that helps users create advanced reports, dashboard metrics, graphs, filters and scheduled report exports.
Which Vtiger versions are supported?
The extension is prepared for Vtiger CRM 7.x and Vtiger CRM 8.x. Older Vtiger 6.x documentation is also available for legacy installations.
Can Reports send reports automatically?
Yes. The Scheduler feature can send selected reports by email at regular intervals and export report data as PDF, Excel or both.
Can I buy Reports separately?
Yes. Reports can be purchased as a standalone Vtiger extension, and it is also included in Extended and All Access packages.
Very well documented
Find step by step manuals for Reports and learn how to create reports, graphs, filters, scheduled reports and dashboard metrics.
Start using Reports for Vtiger CRM
Build advanced reports, visualize CRM data and automate report delivery. Compatible with Vtiger 7.x and Vtiger 8.x.
Explore All Vtiger Extensions
Browse our complete collection of Vtiger extensions and discover more tools for your CRM.